Using Grafana for IoT: Benefits, Challenges & Best Practices
Written by:

Kostiantyn Oliynyk
Head of IoT at Webbylab
With a robust academic background in Telecommunication Systems Engineering, I apply my knowledge to lead innovations in the IoT domain. Starting as the first team member in the newly formed IoT department at WebbyLab, I've spearheaded its growth, fostering the expansion into embedded and hardware development alongside our core software projects. My dedication lies in pushing the boundaries of IoT technology, fostering a culture of innovation and excellence that profoundly impacts our clients' operational success.
FAQ
What is the cost of implementing Grafana for IoT?
The implementation costs can vary depending on the size and complexity of your IoT infrastructure and the number of connected devices. Even though you can use a free version of Grafana, you may need additional functionalities at an extra price. You can always contact our experts to get precise calculations.
What is the importance of Grafana in IoT?
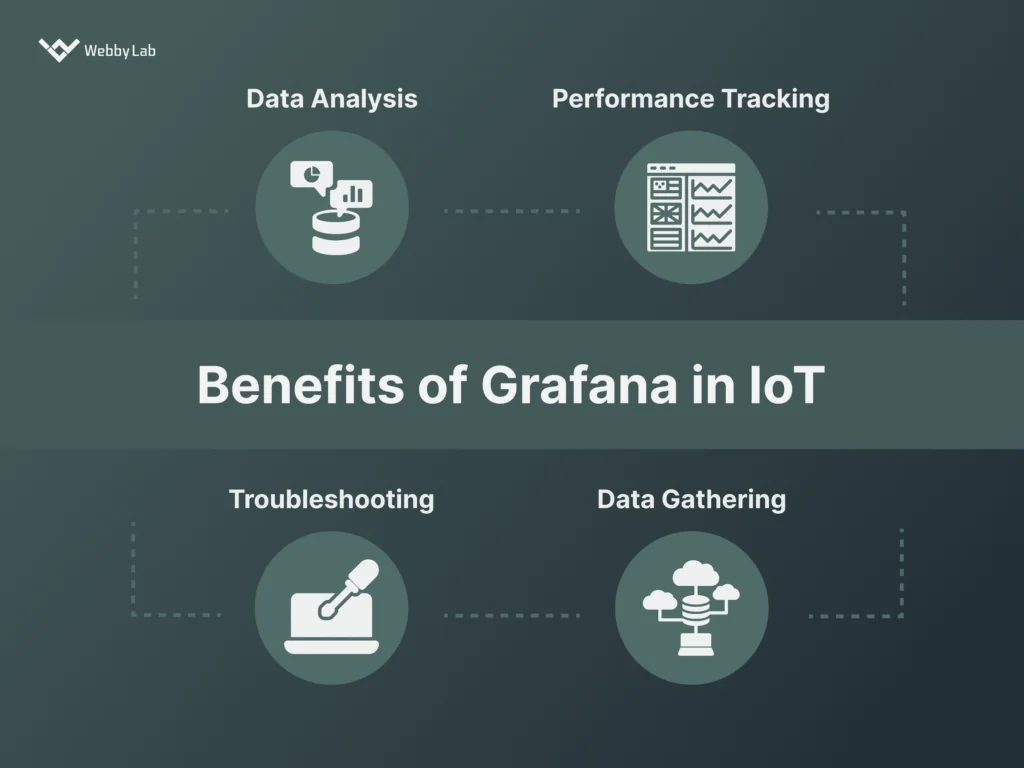
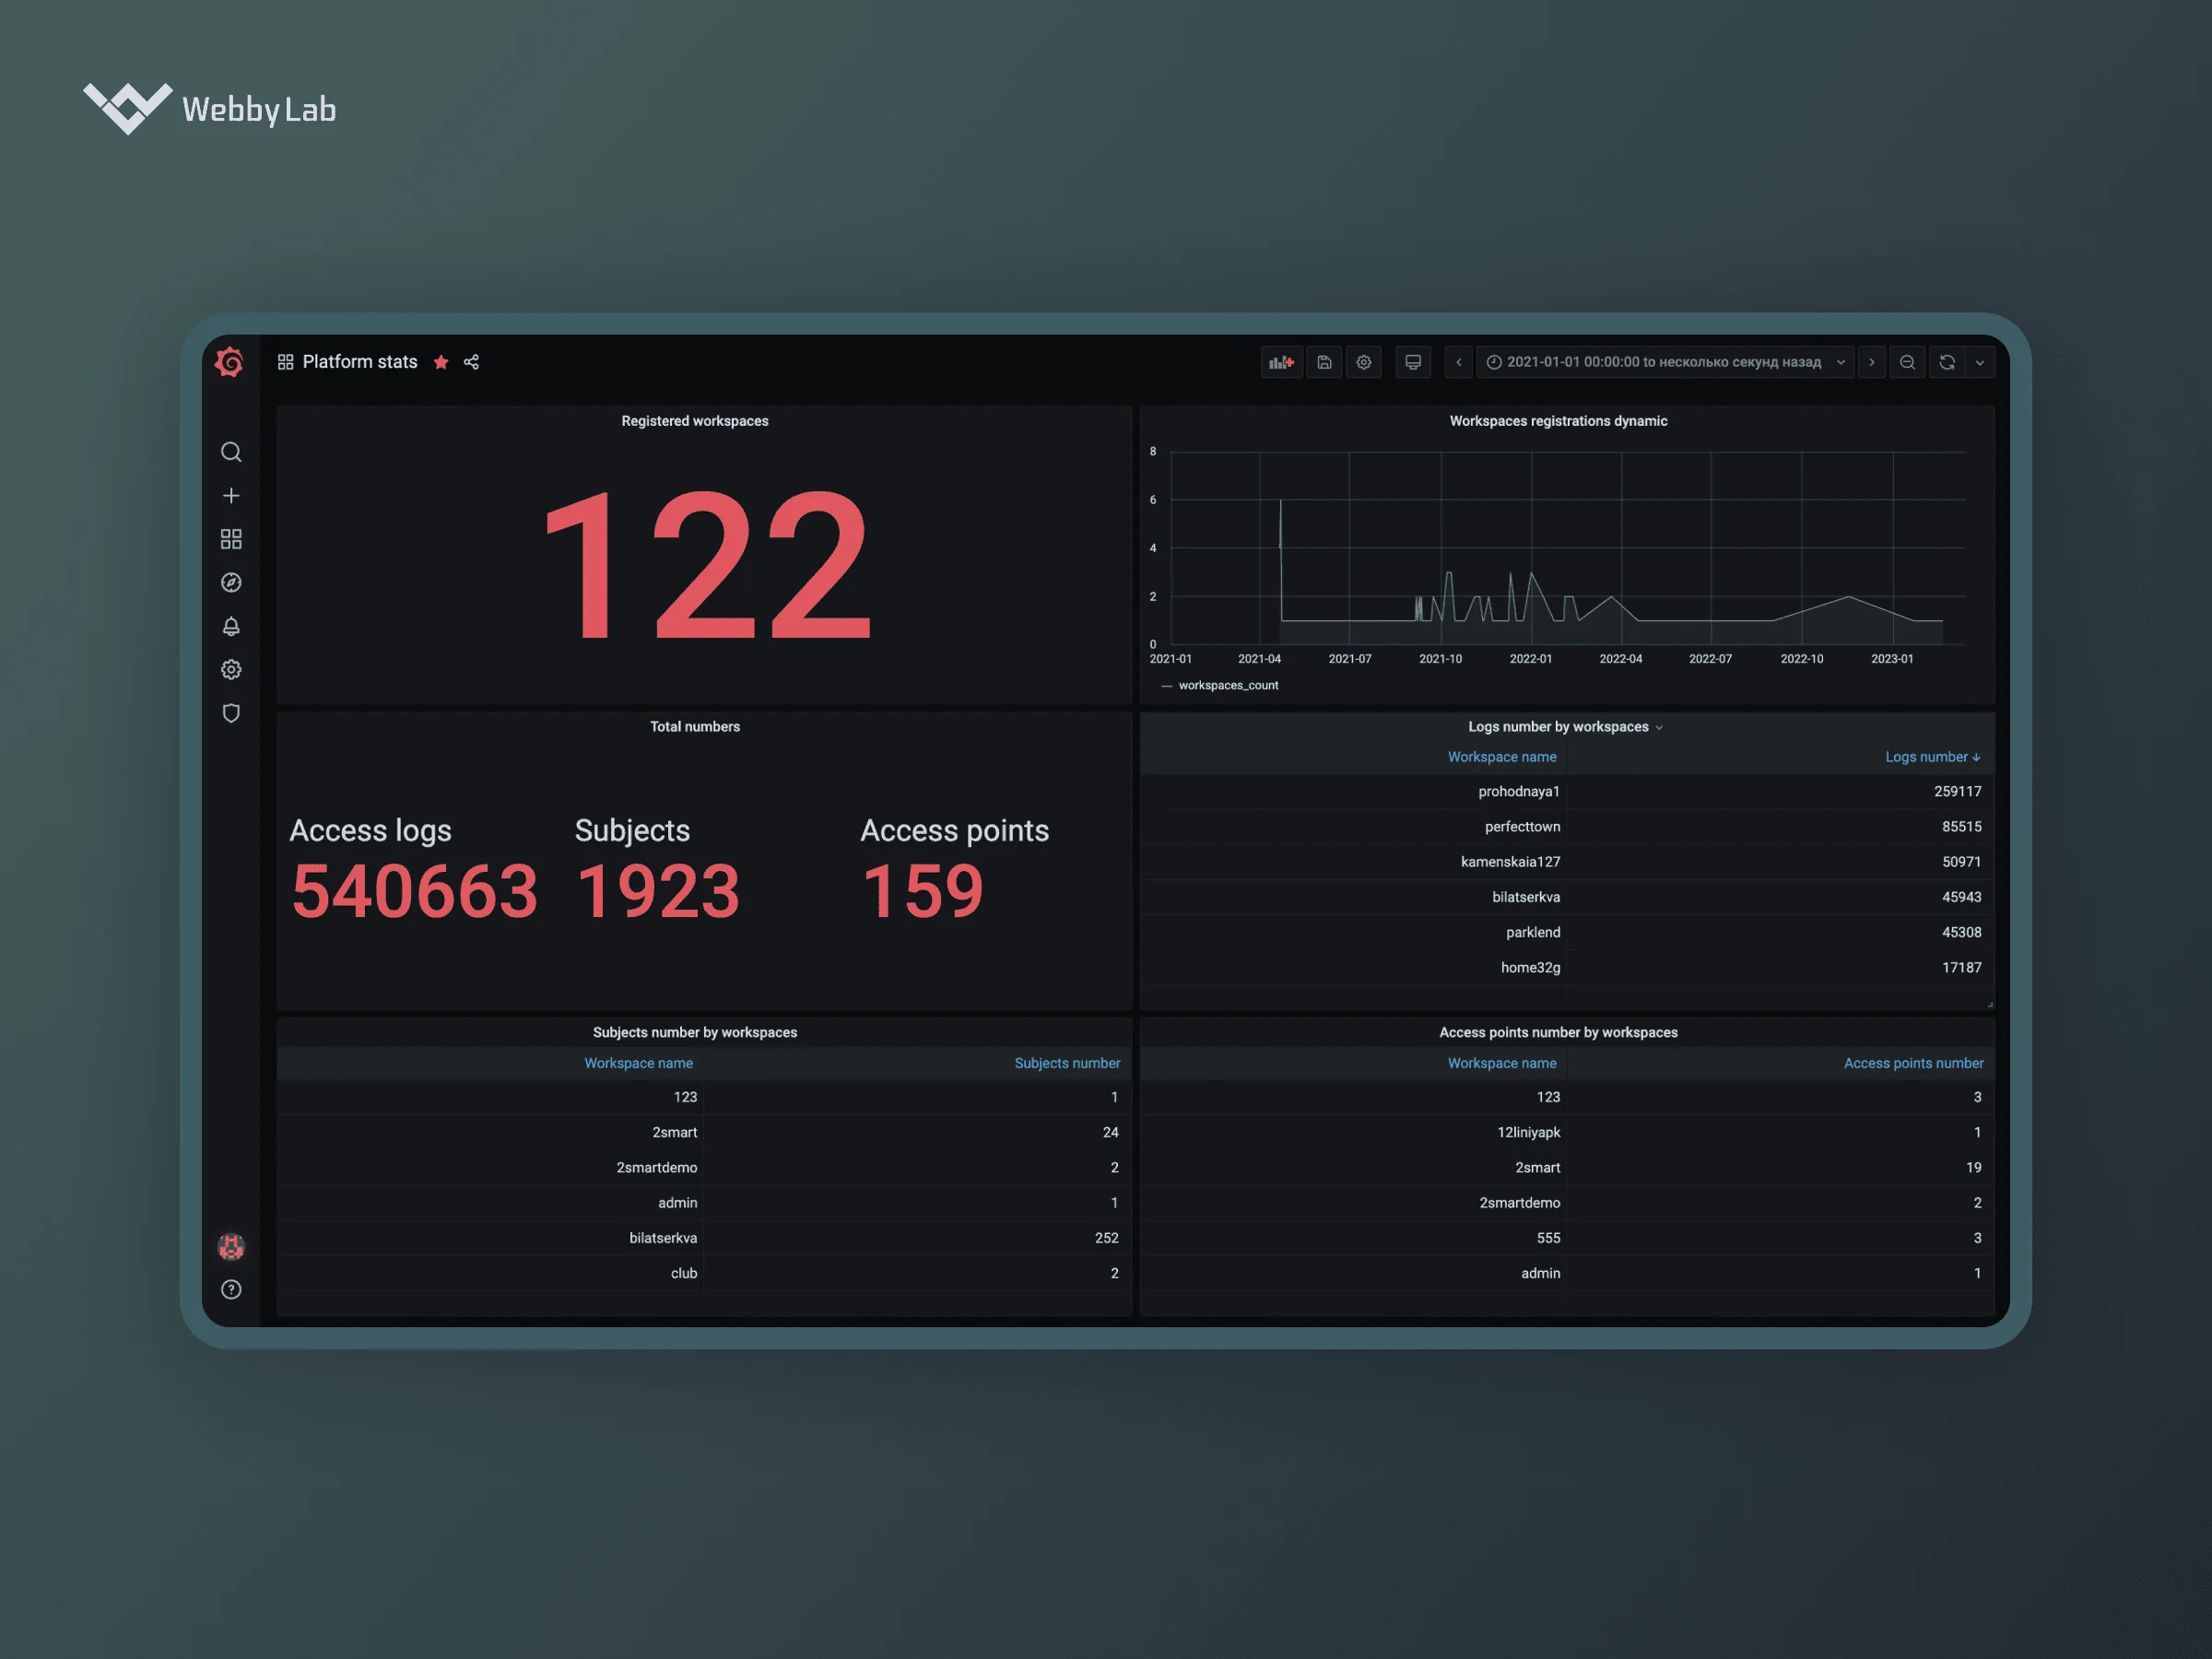
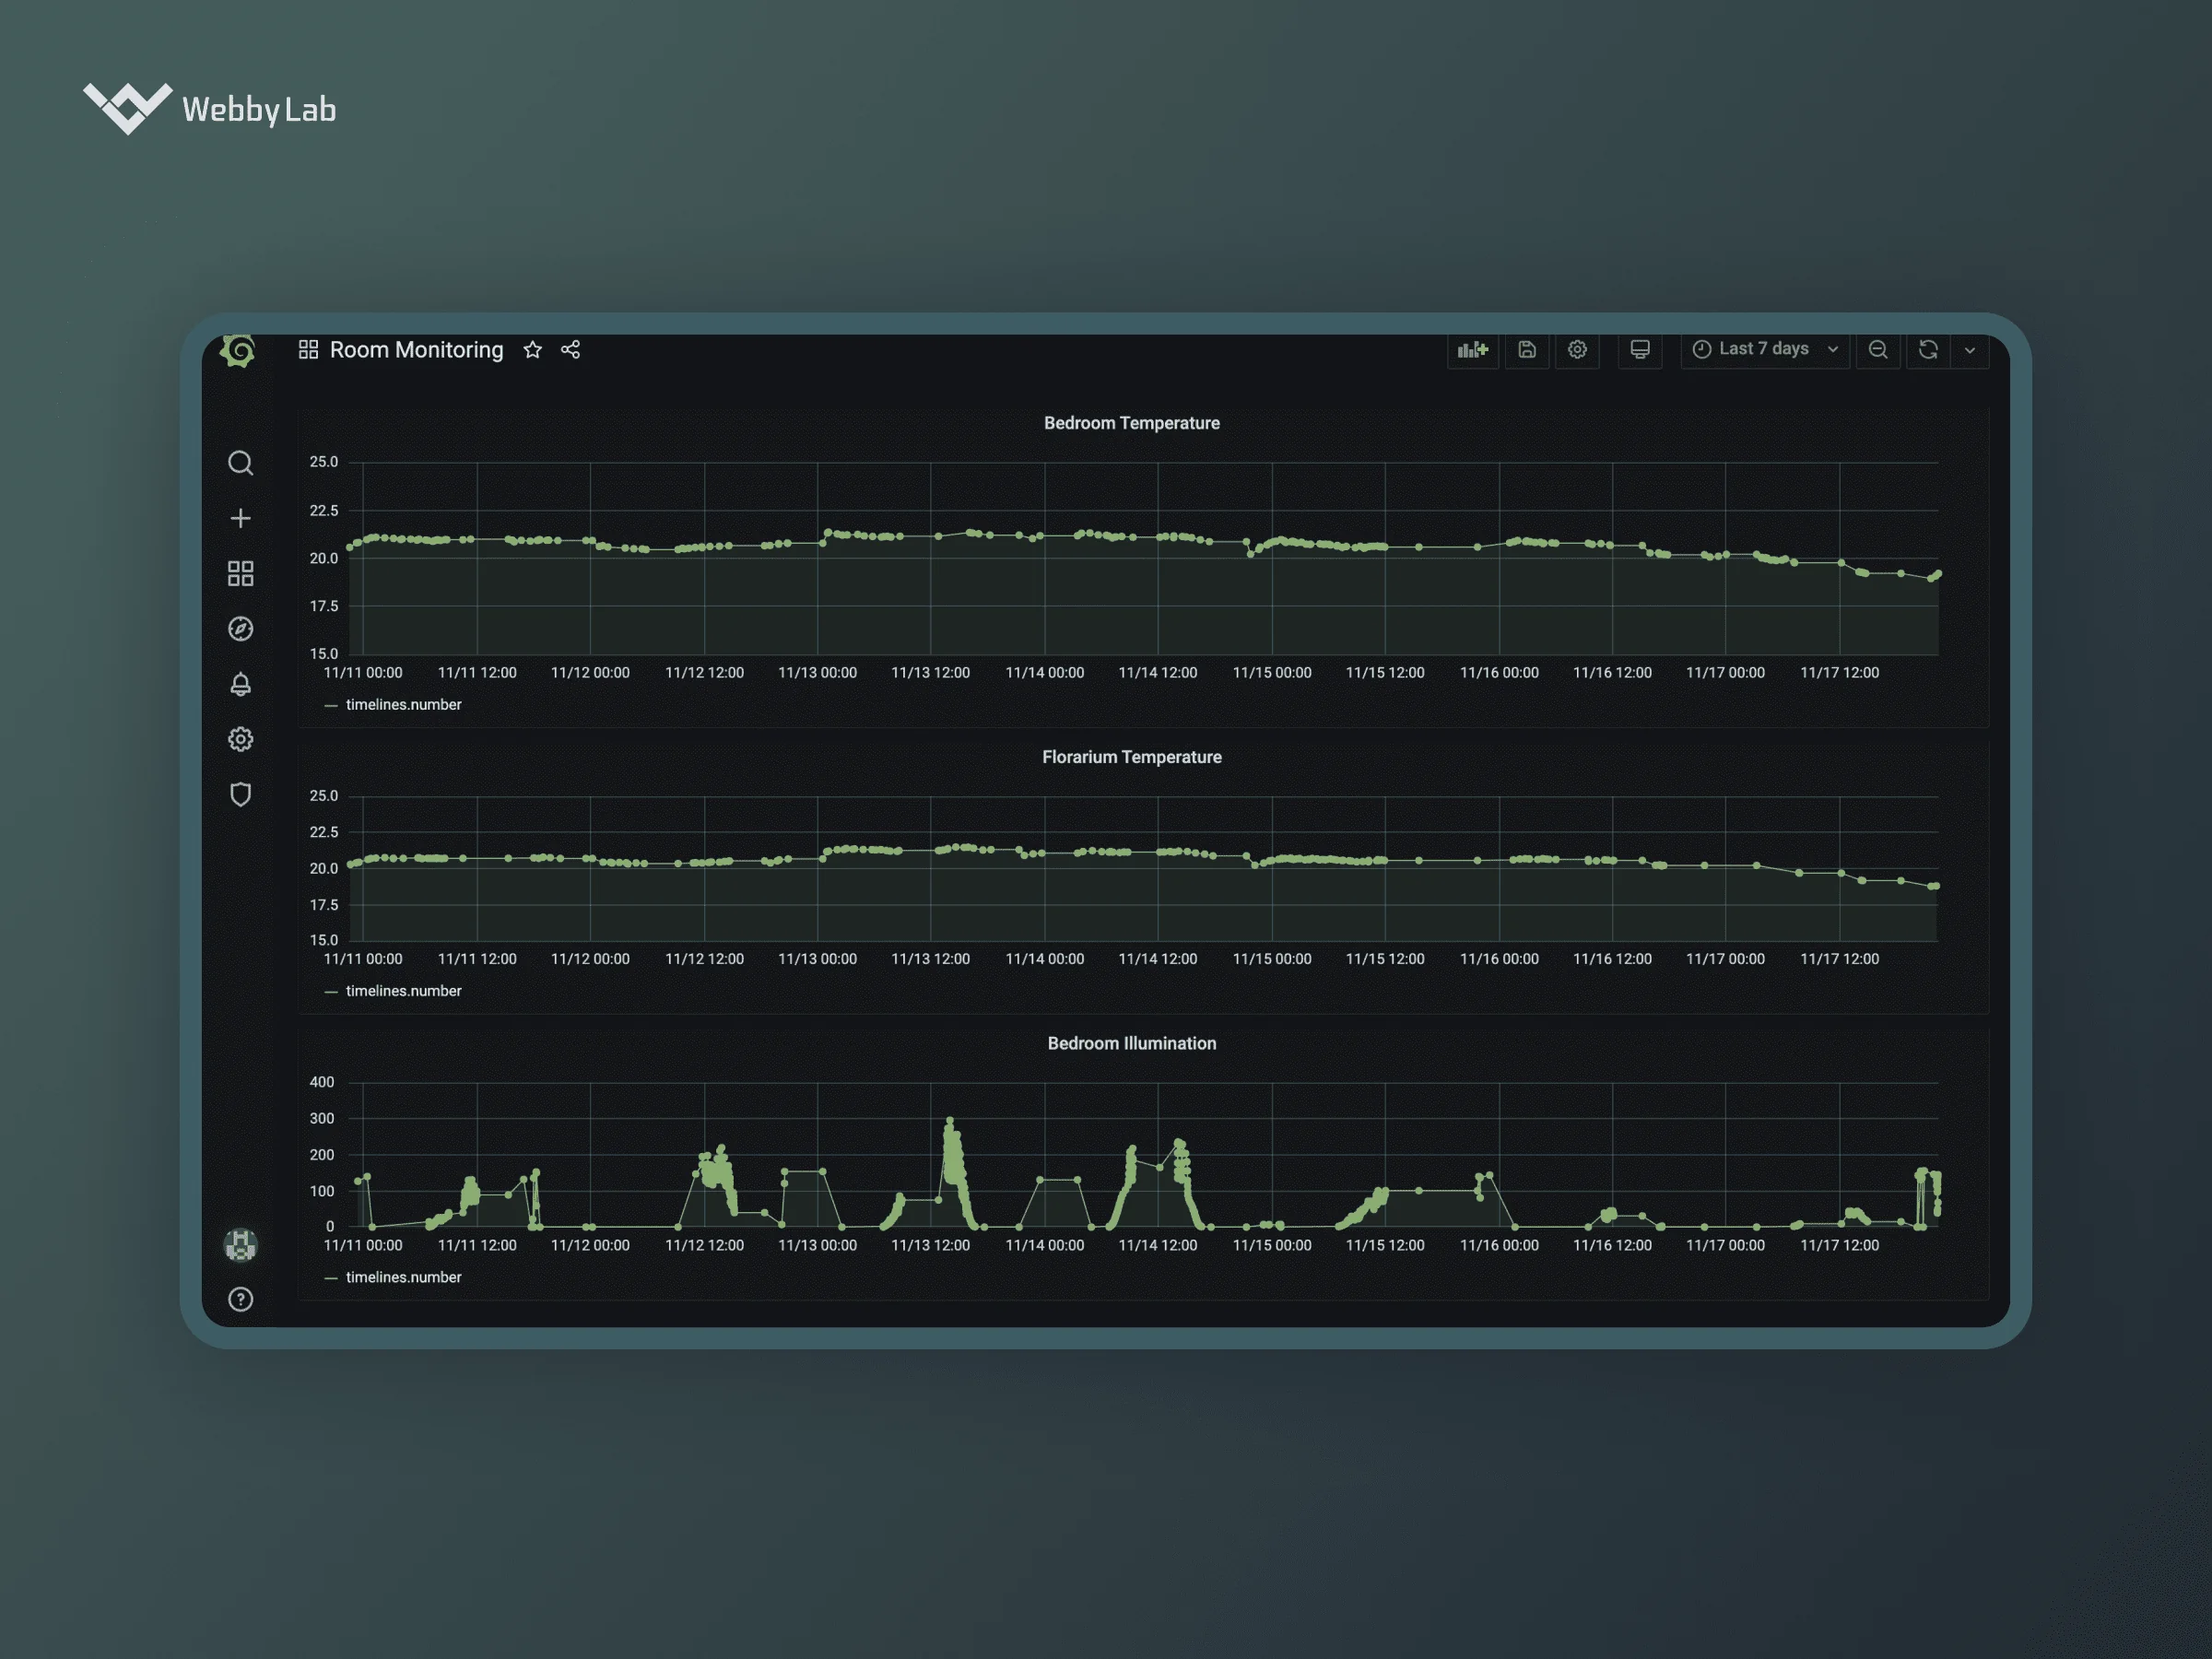
The Grafana dashboard is critical for IoT, as it allows for gaining valuable insights into the IoT devices’ data through visualization and analytics tools. This platform is also helpful in real-time monitoring and performance metrics tracking, simplifying the troubleshooting process, improving work efficiency, and enhancing decision-making.
How is Grafana used in the IoT?
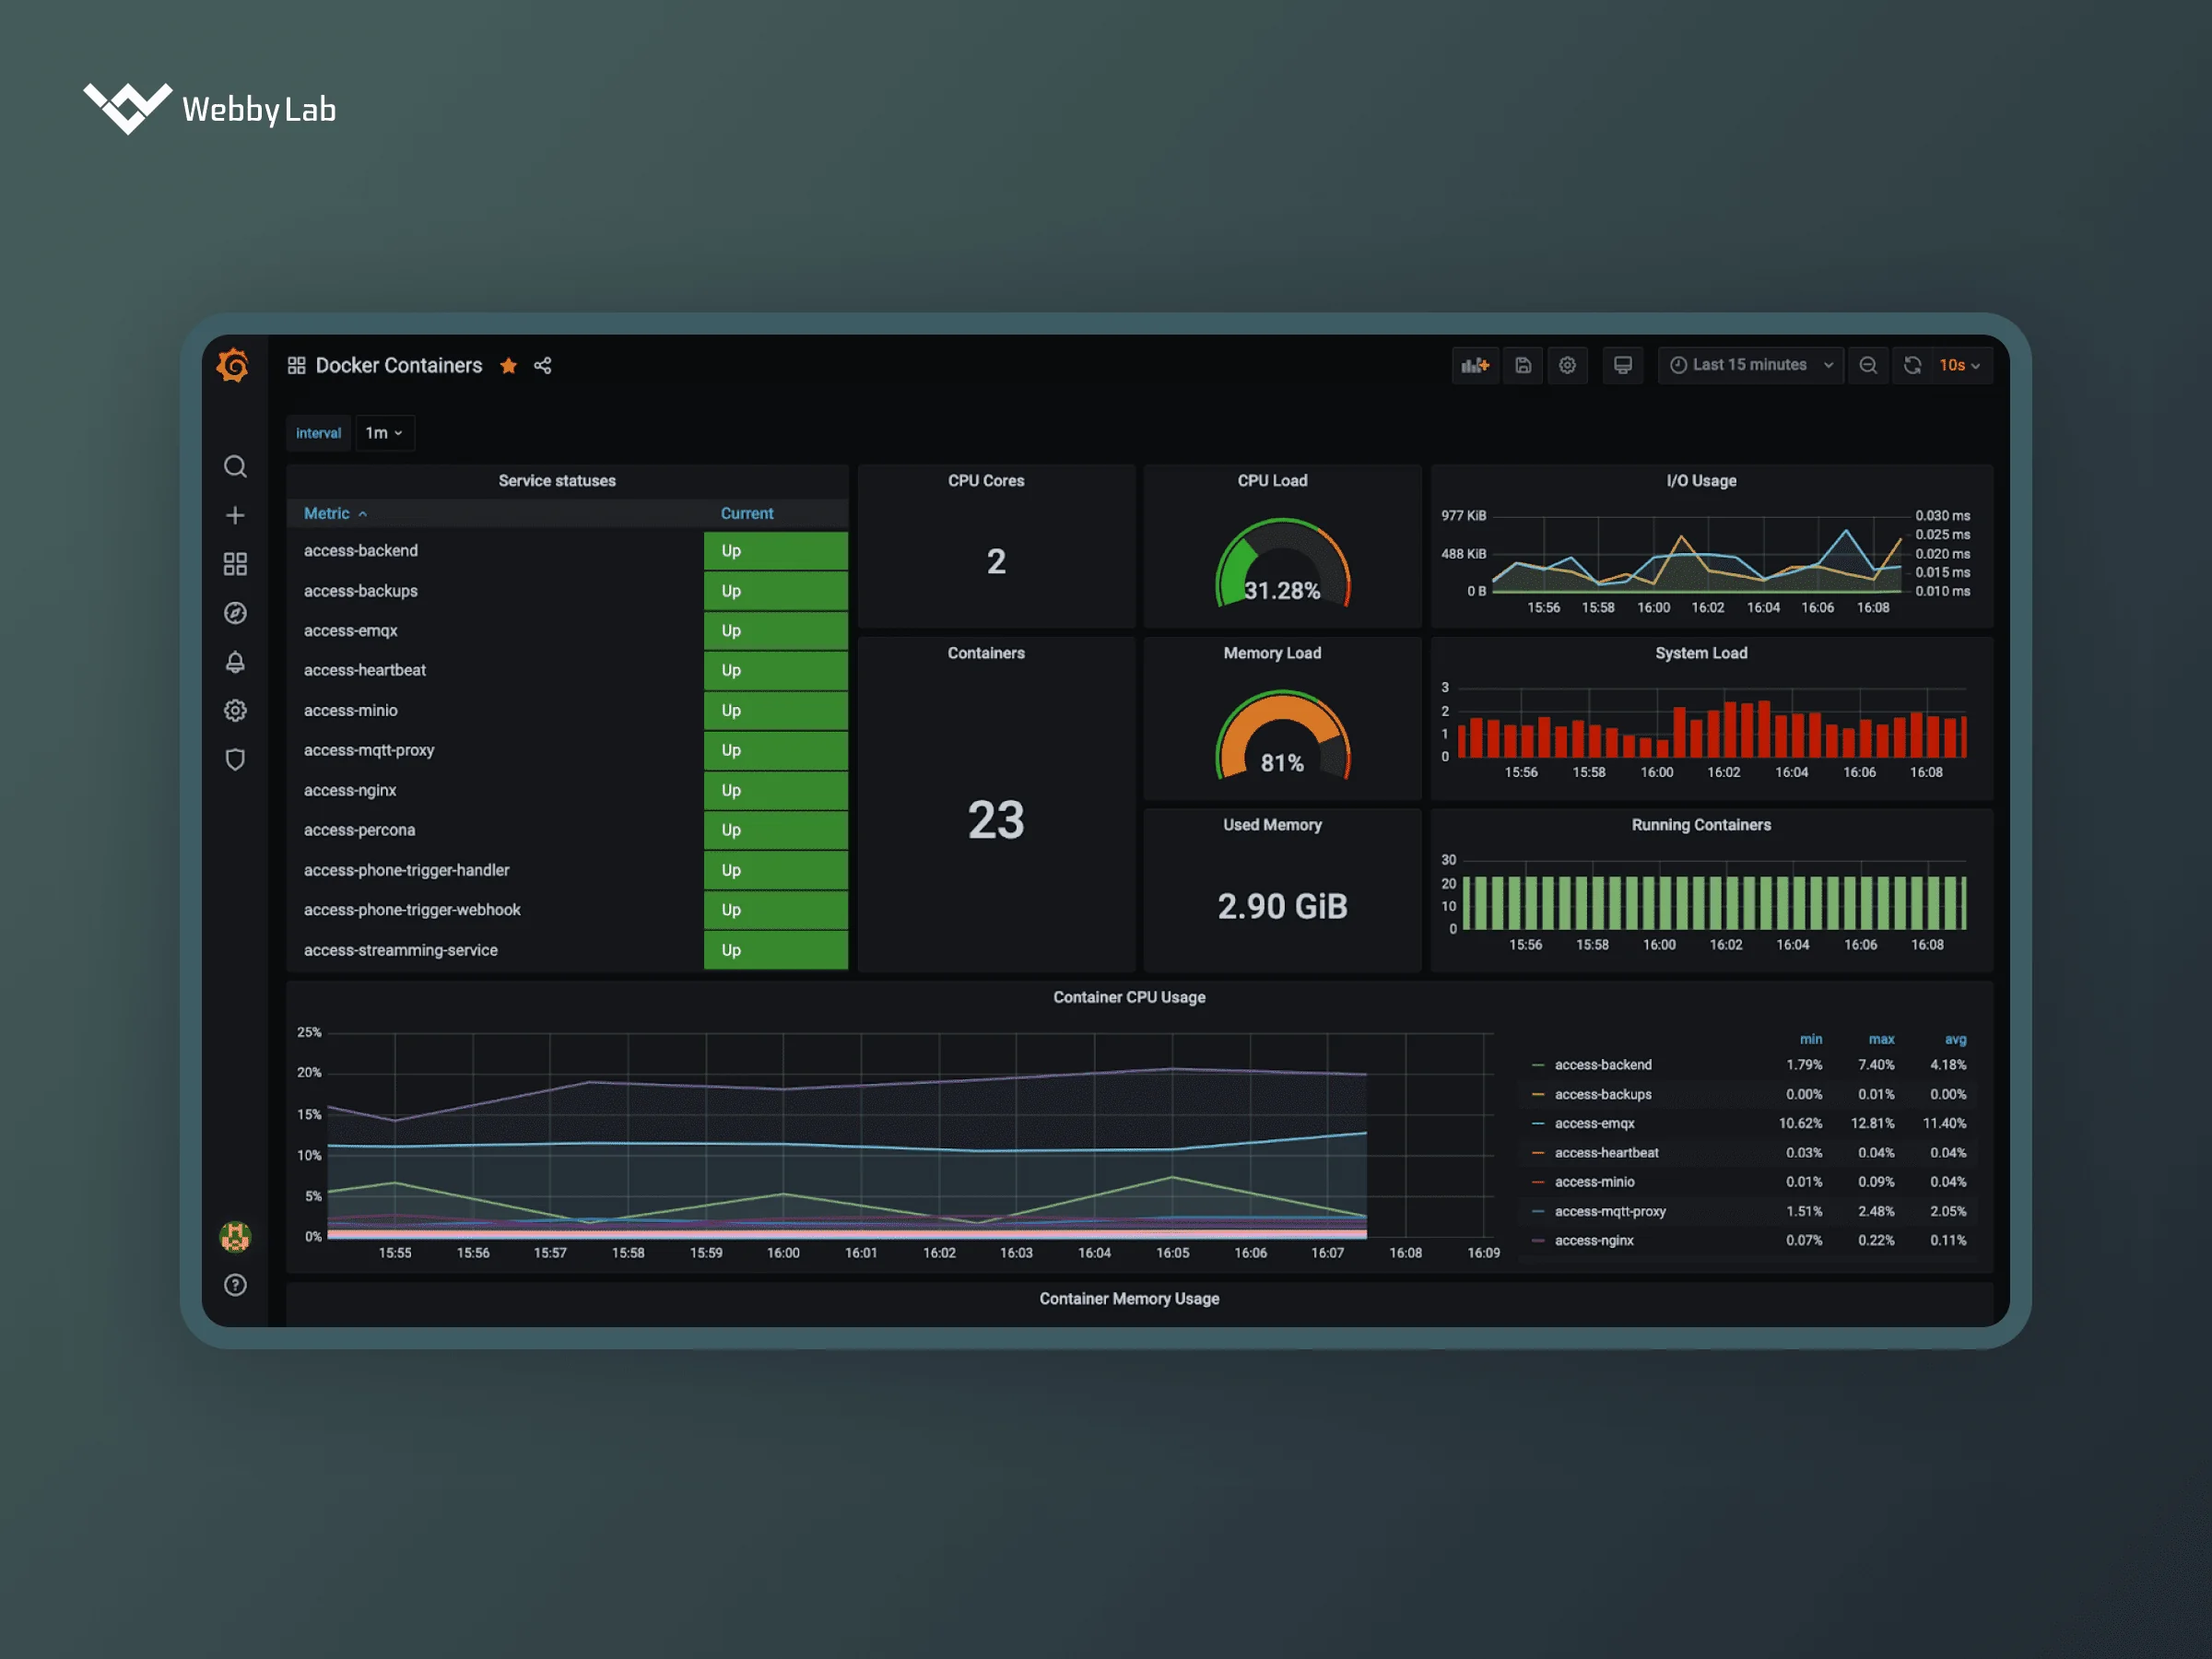
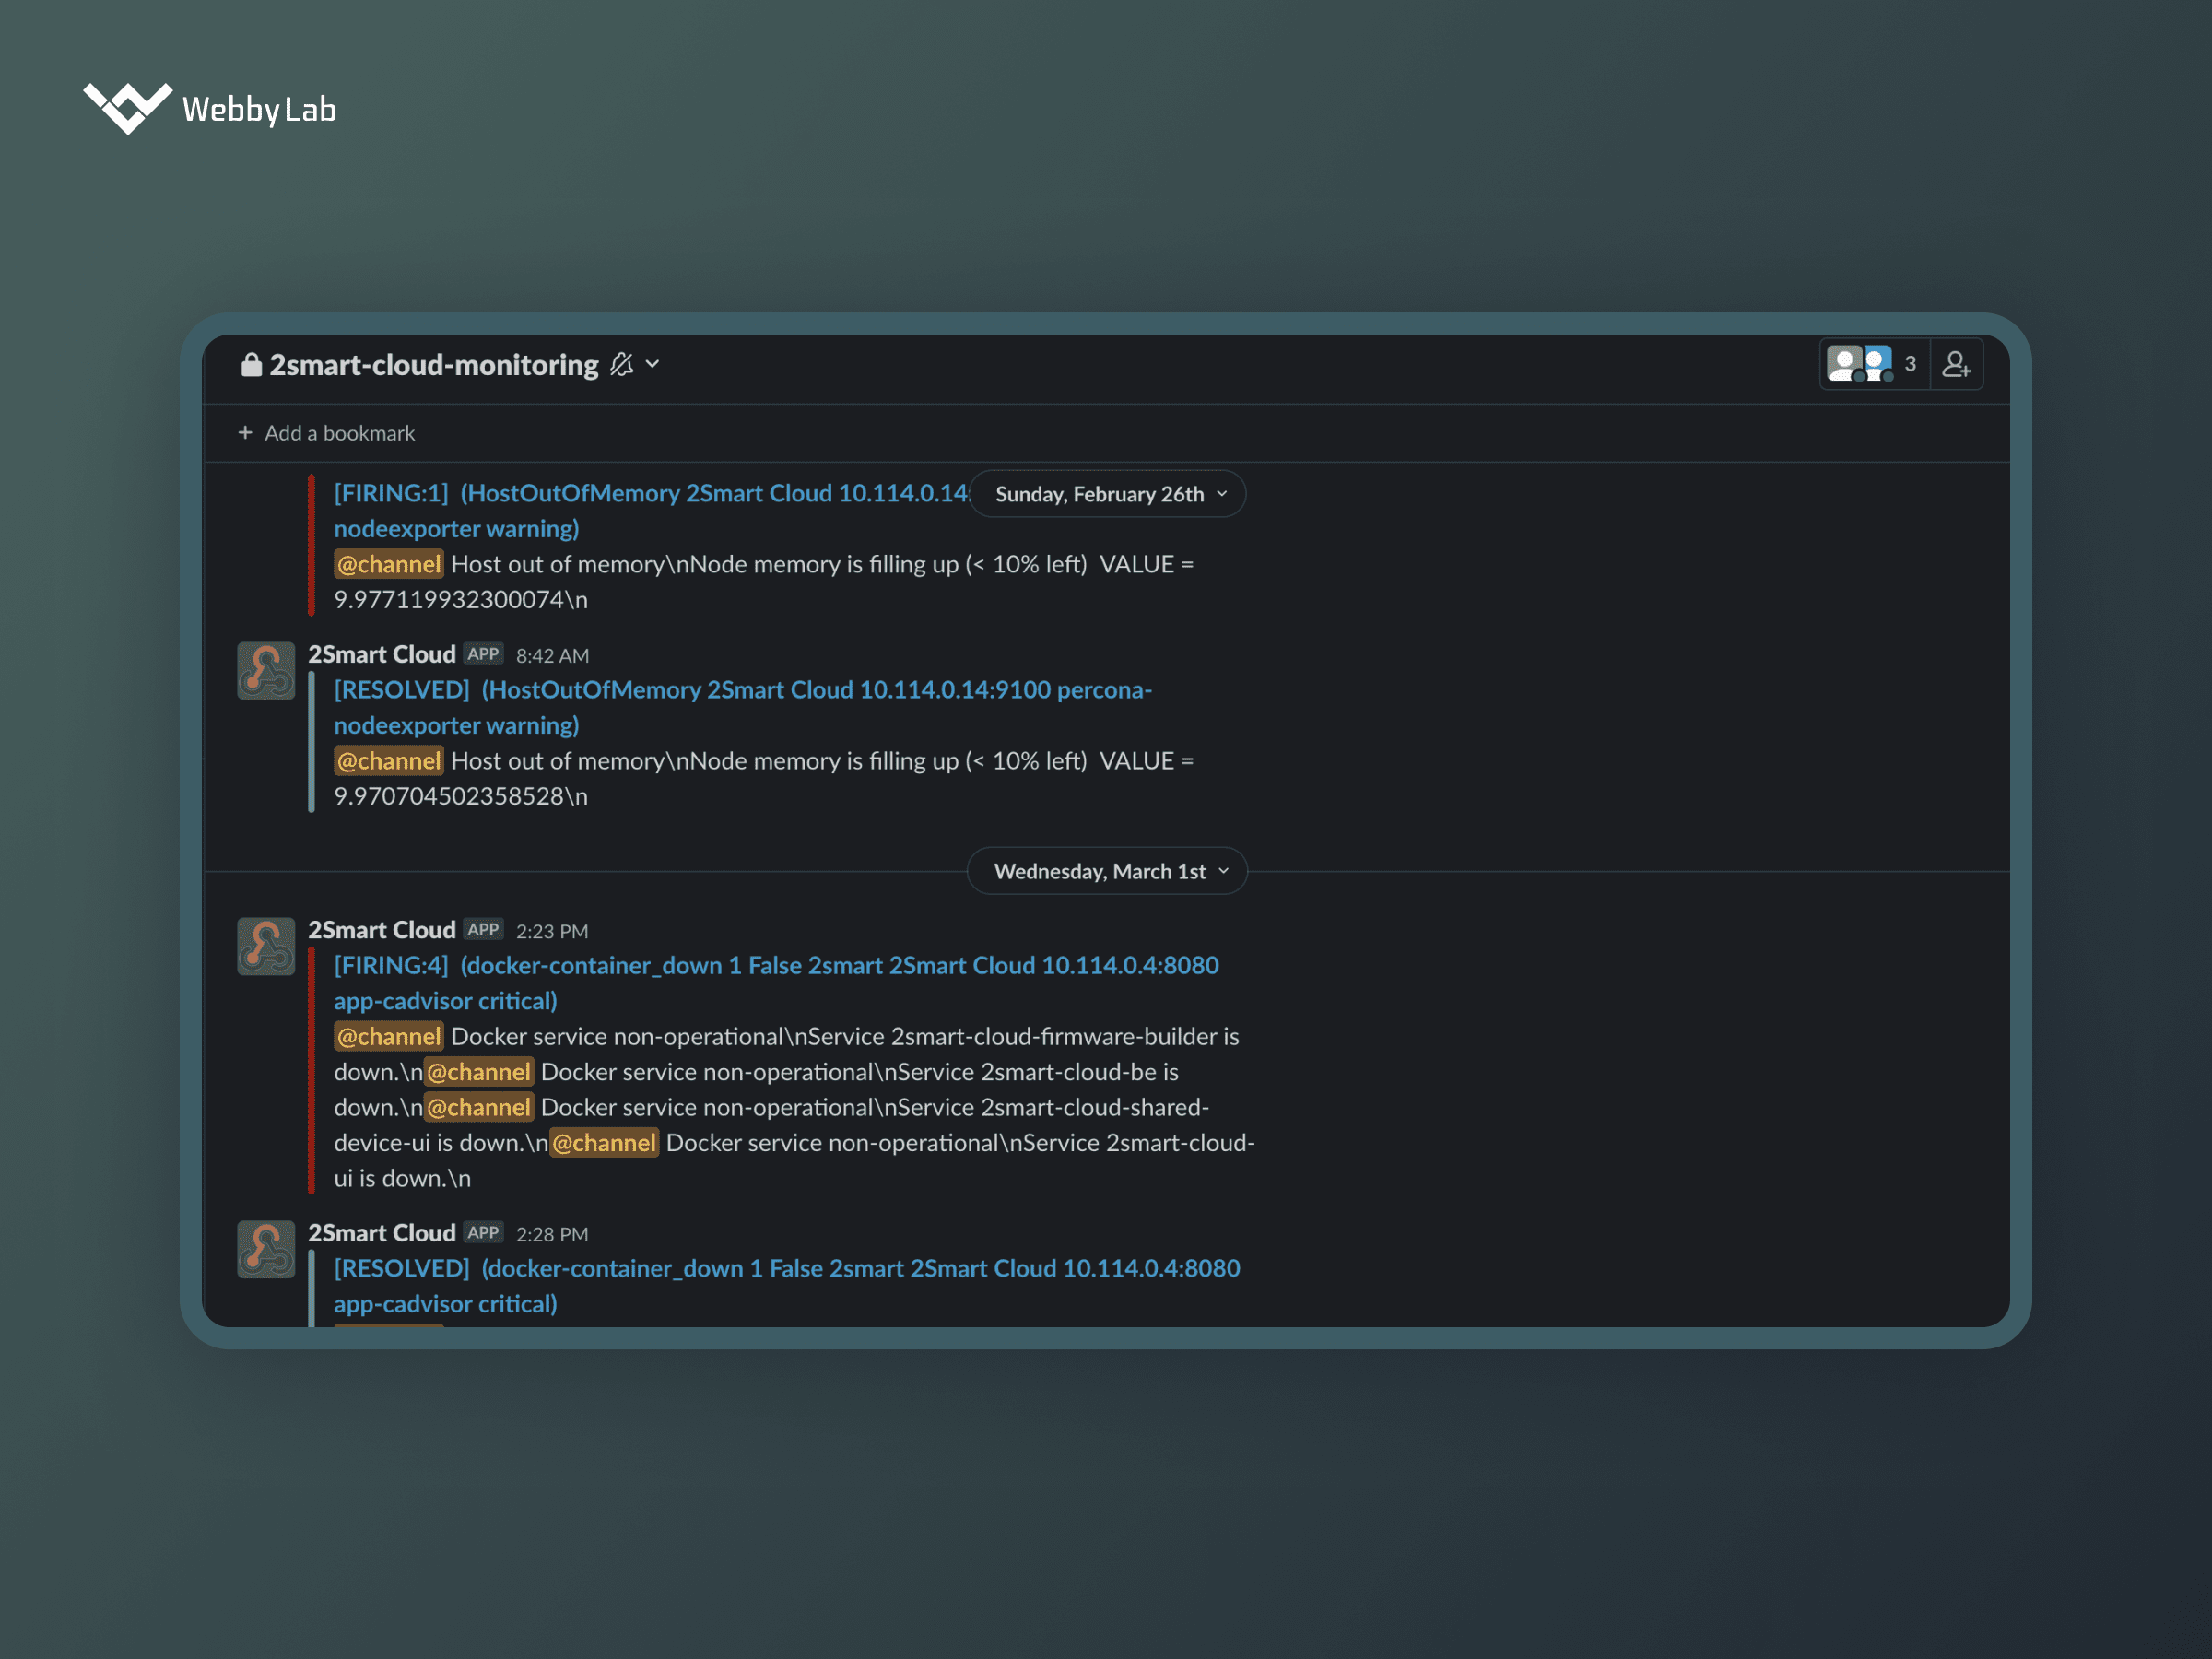
Grafana is used to gather and analyze data from IoT devices through various data sources, such as databases and APIs. It helps to visualize IoT data on customizable dashboards via graphs, tables, and charts. This platform also features alerts and notifications to keep users informed on the latest updates in the IoT infrastructure.
What are the advantages and disadvantages of using Grafana in IoT?
The advantages of using Grafana in IoT include the following:
Real-time monitoring
Data visualization
Advanced analytics
Customizable dashboards
Various data sources support
Easy integration with third-party tools
As for the disadvantages, they may include:
The need for technical expertise to set up and maintain
Potential security risks if not configured properly
