Chrome DevTools Feature Guide

In the world of modern software development, streamlined efficiency and enhanced productivity are the hallmarks of success. That is why Chrome DevTools is an indispensable set of features that empowering developers with unparalleled capabilities.
So, join us as in this article we embark on this exciting adventure into the realm of Chrome DevTools. By the end of this journey, you will be equipped with the tools you need to elevate your development process to new heights. Let’s dive in and unlock the boundless possibilities of Chrome DevTools together!
Chrome Developer Tools: definition and purpose
Google Chrome provides developers with a toolkit commonly known as Chrome Developer Tools. It is a lifesaver for fast and convenient debugging, testing and enhancing web application performance. In short, with Chrome DevTool features, developers can examine and modify the Document Object Model (DOM), preview and edit the Cascading Style Sheets (CSS) of a webpage, and work with JavaScript code.
Let’s open Chrome DevTools!
Discover the table below to choose the most suitable way to open Developer Tools.
Note, that there may be differences depending on operating systems and settings.
|
Windows OS |
Linux OS |
macOS |
|
| Hotkeys
|
F12 | Command + Option + I | |
| Ctrl + Shift + I | |||
| Command line
|
Run command: |
||
start chrome -- auto-open- devtools-for-tabs |
google-chrome - -auto-open- devtools-for-tabs |
open -a "Google Chrome" - -args --auto-open-devtools -for-tabs |
|
| Bowser menu
|
Make right-click on the page or specific element → select “Inspect” option. | ||
| Chrome menu | Click on the three dots menu in the upper right corner of the browser window → select “More Tools” → select “Developer Tools”. | ||
Tips and tricks for using each tab to troubleshoot websites
Settings info
Click on three dots menu and change placement of DevTools relative to the page for your own convenience.
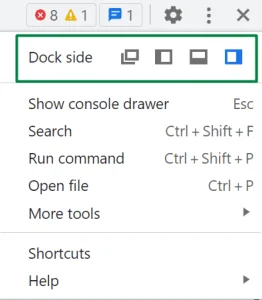
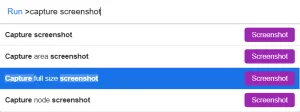
In the same menu there is “Run command” option (hotkey Ctrl + Shift + P/Command + Shift + P). Among the variety of different commands, it is worth paying attention to the ability to take a full size screenshot of the page and capture specific node screen.
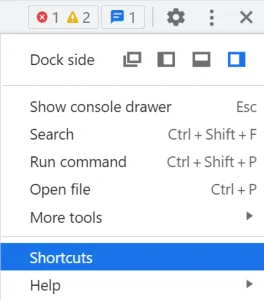
List of hotkeys for advanced using of DevTools is available in the “Shortcuts” from three dots menu.
Elements tab
In this tab you can examine the entire DOM structure of the page and the CSS styles used on it.
* All examples are demonstrated on the site https://demoqa.com/. It is a free source for testing common types of DOM elements (such as date pickers, contact forms, buttons, selectors etc.) and example of Book Store Application.
Use the cursor button to select a specific element on the page for inspection.
Depending on the needs of the developer, page components can be edited, replaced, deleted, duplicated, hidden or copied in different ways. List of options is displayed in the menu after right-click on the element. However, all changes will be saved until the page is refreshed.
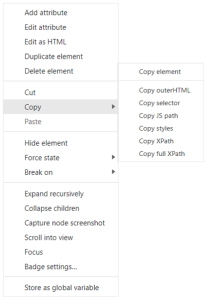
If you need to debug JavaScript code, use the “Break on” feature to set breakpoints. There are three types of changes: subtree modifications, attributes modifications, node removal. It is possible to reveal, enable, disable or remove added breakpoints in the panel tab.
Using the Ctrl + F/Command + F hotkey will help you to find an element by string, selector or XPath in the DOM tree. This is an indispensable tool for automated testing and may also be necessary if you need to count the number of certain elements on the page.
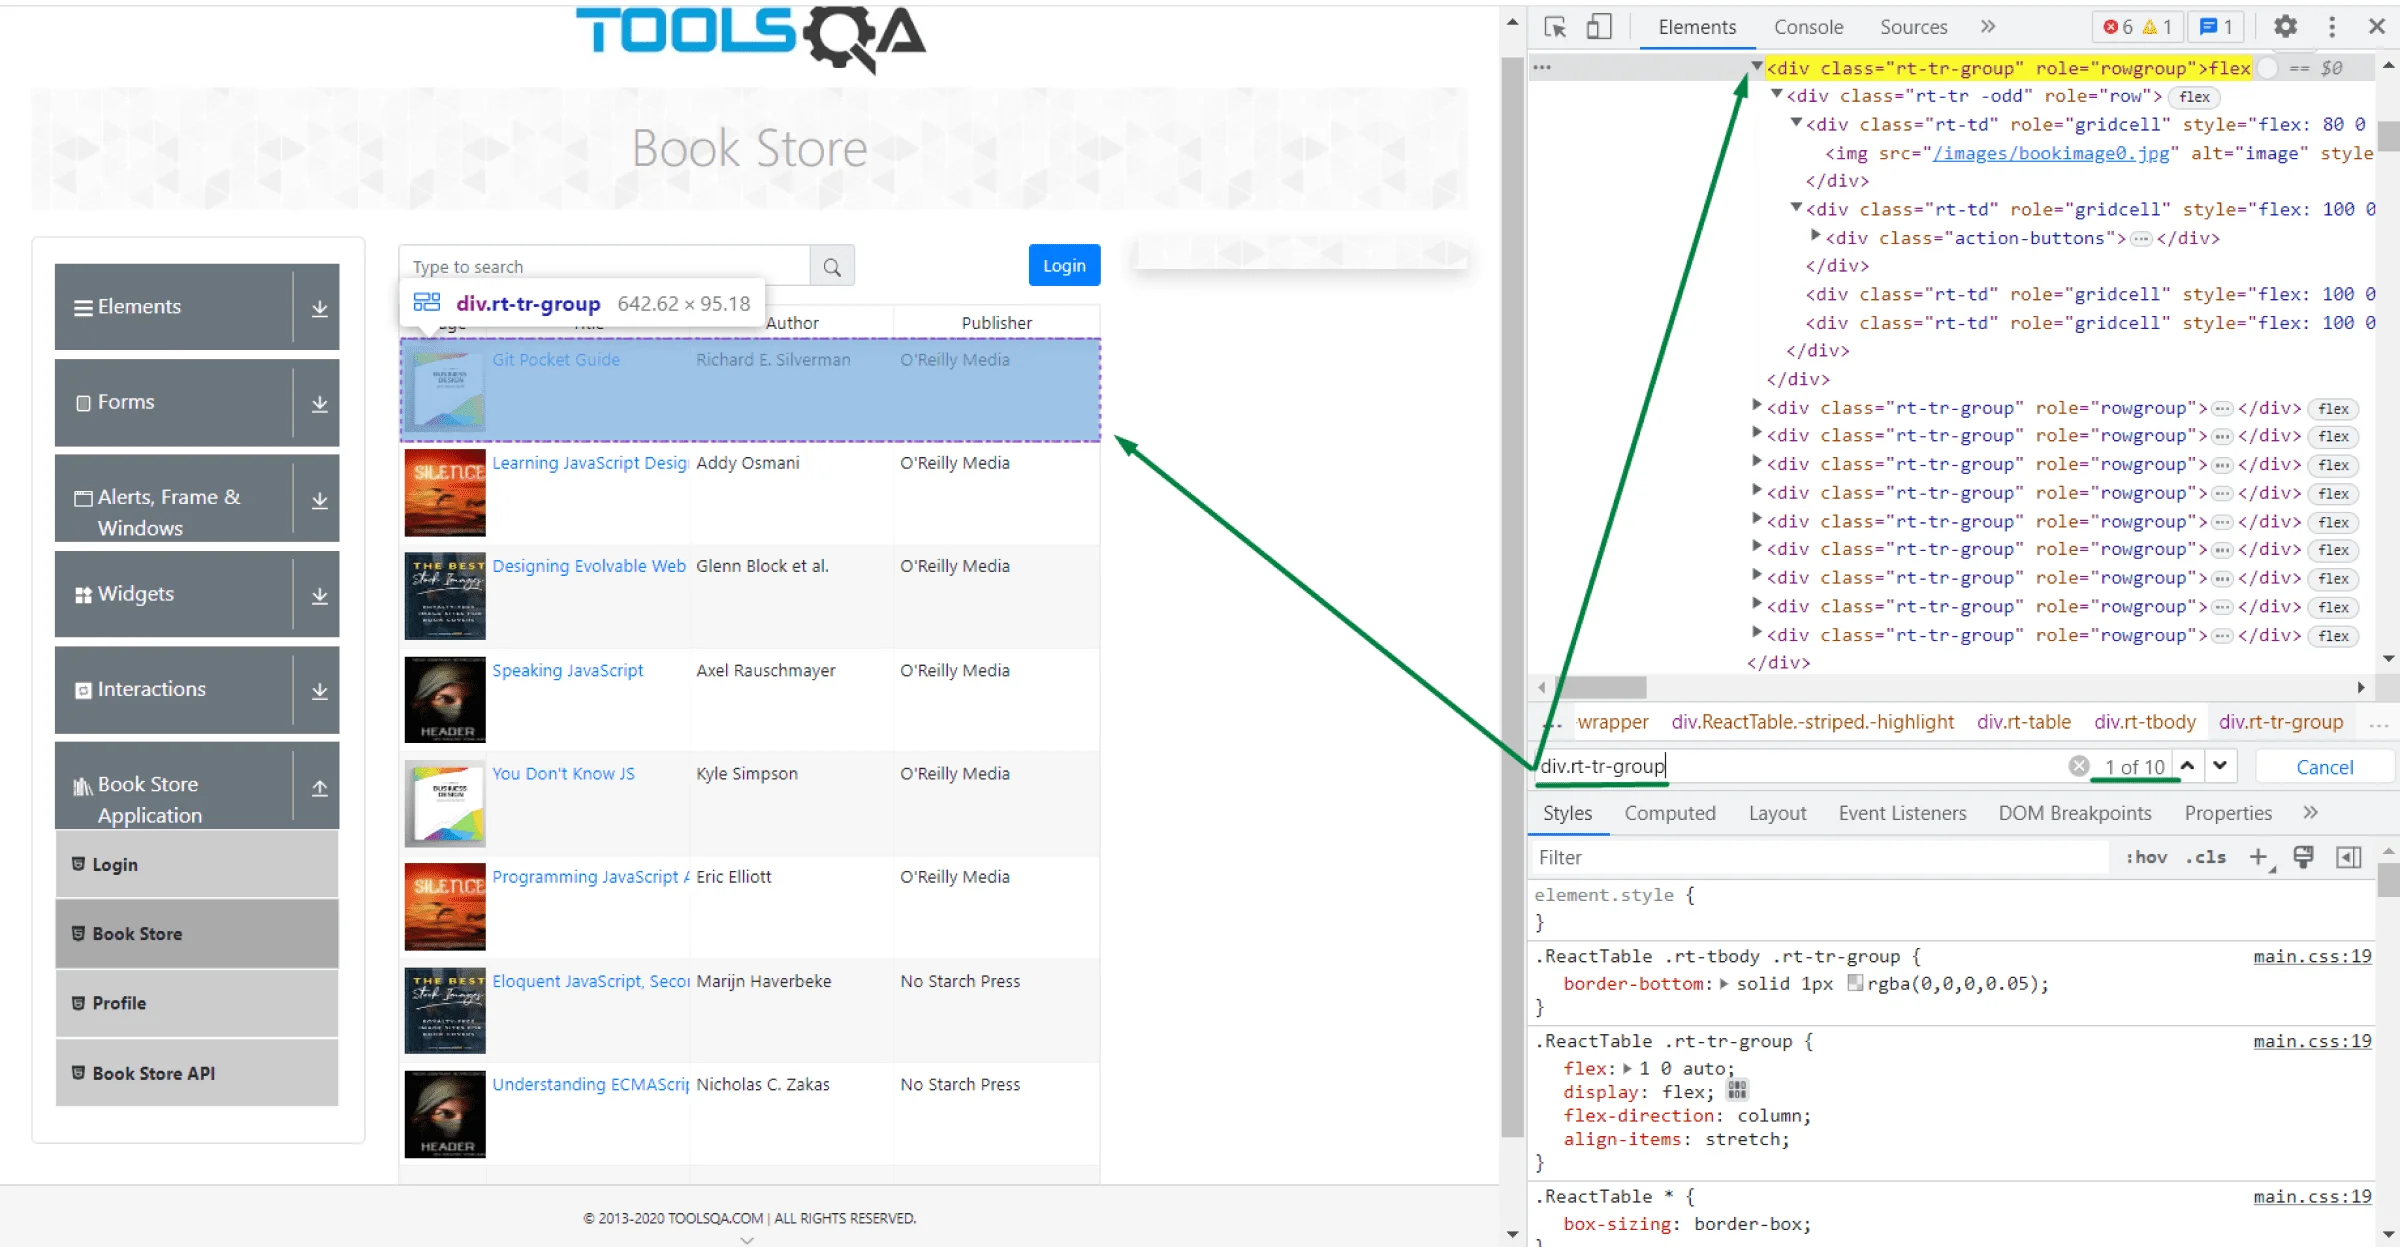
In the same way as you can interact with DOM structure, it is possible to change CSS styles of elements on the page in the “Styles” tab. Components values that the browser is actually using on the rendered website are displayed in the “Computed” tab. Sometimes it helps to understand why some fragments aren’t shown correctly.
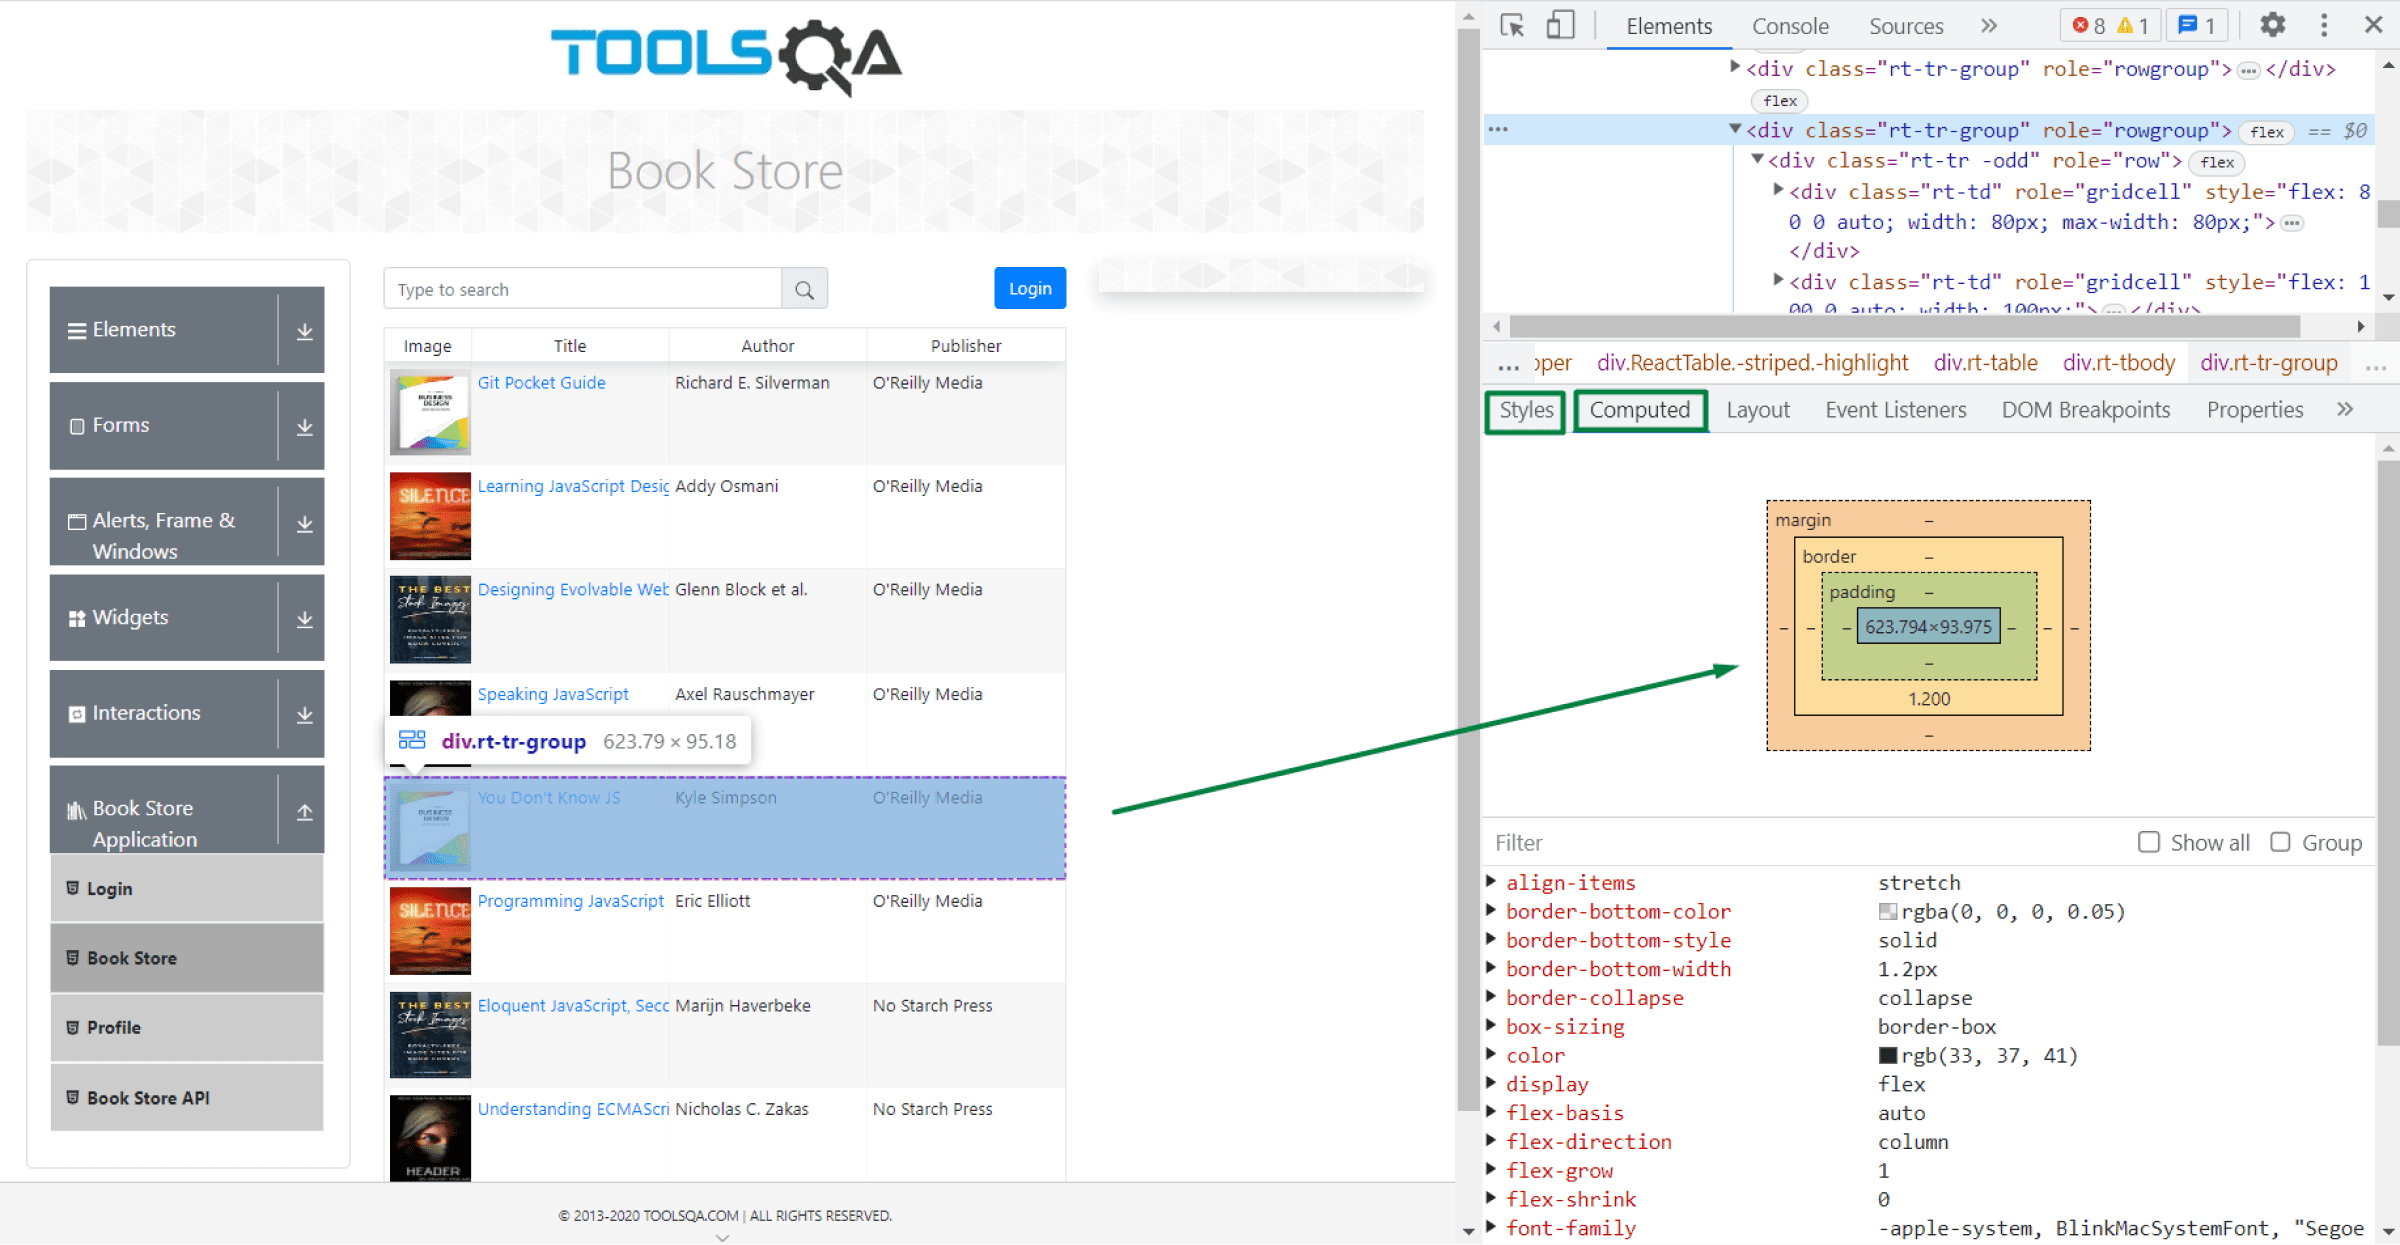
Click on the icon on the panel to open the toggled device toolbar. This is a useful feature that provides a view of the webpage on displays of different sizes. You can use the available emulated devices or add custom ones. Some of them even support rotation
.
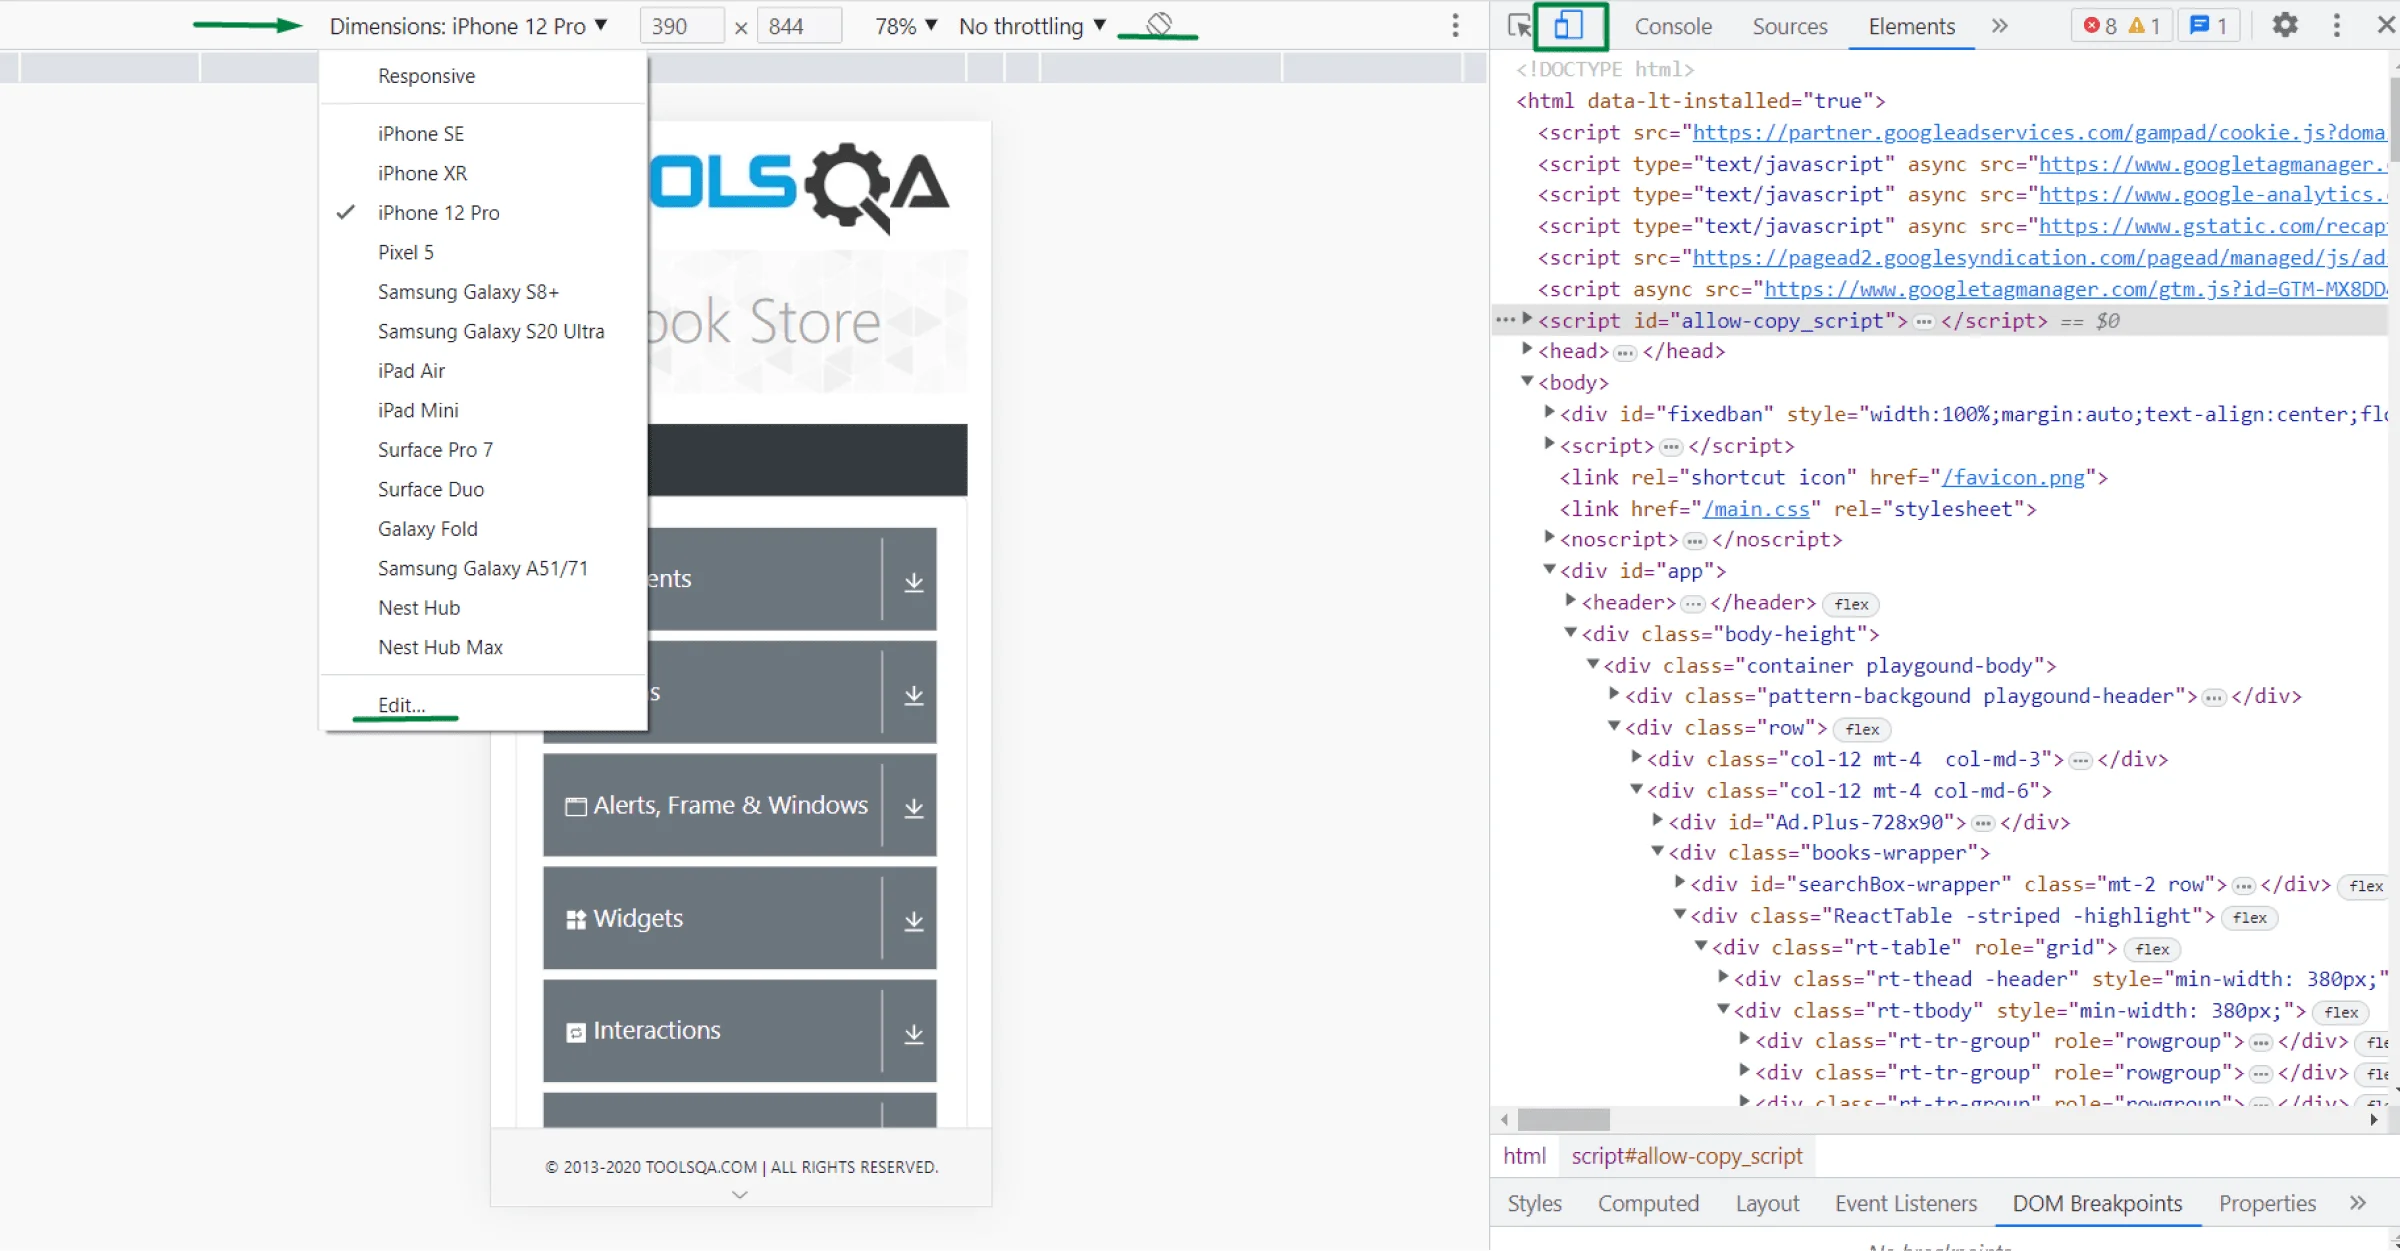
Among the features of Chrome Development Tool, the capabilities of the Console tab occupy an important place. Its use allows developers to execute JS scripts, interact with DOM elements and view custom logs that have been outputted by JavaScript code.
Simple example of interaction with page
Task: count the number of cards with books on the page.
Resolution: short expression below performs it immediately.
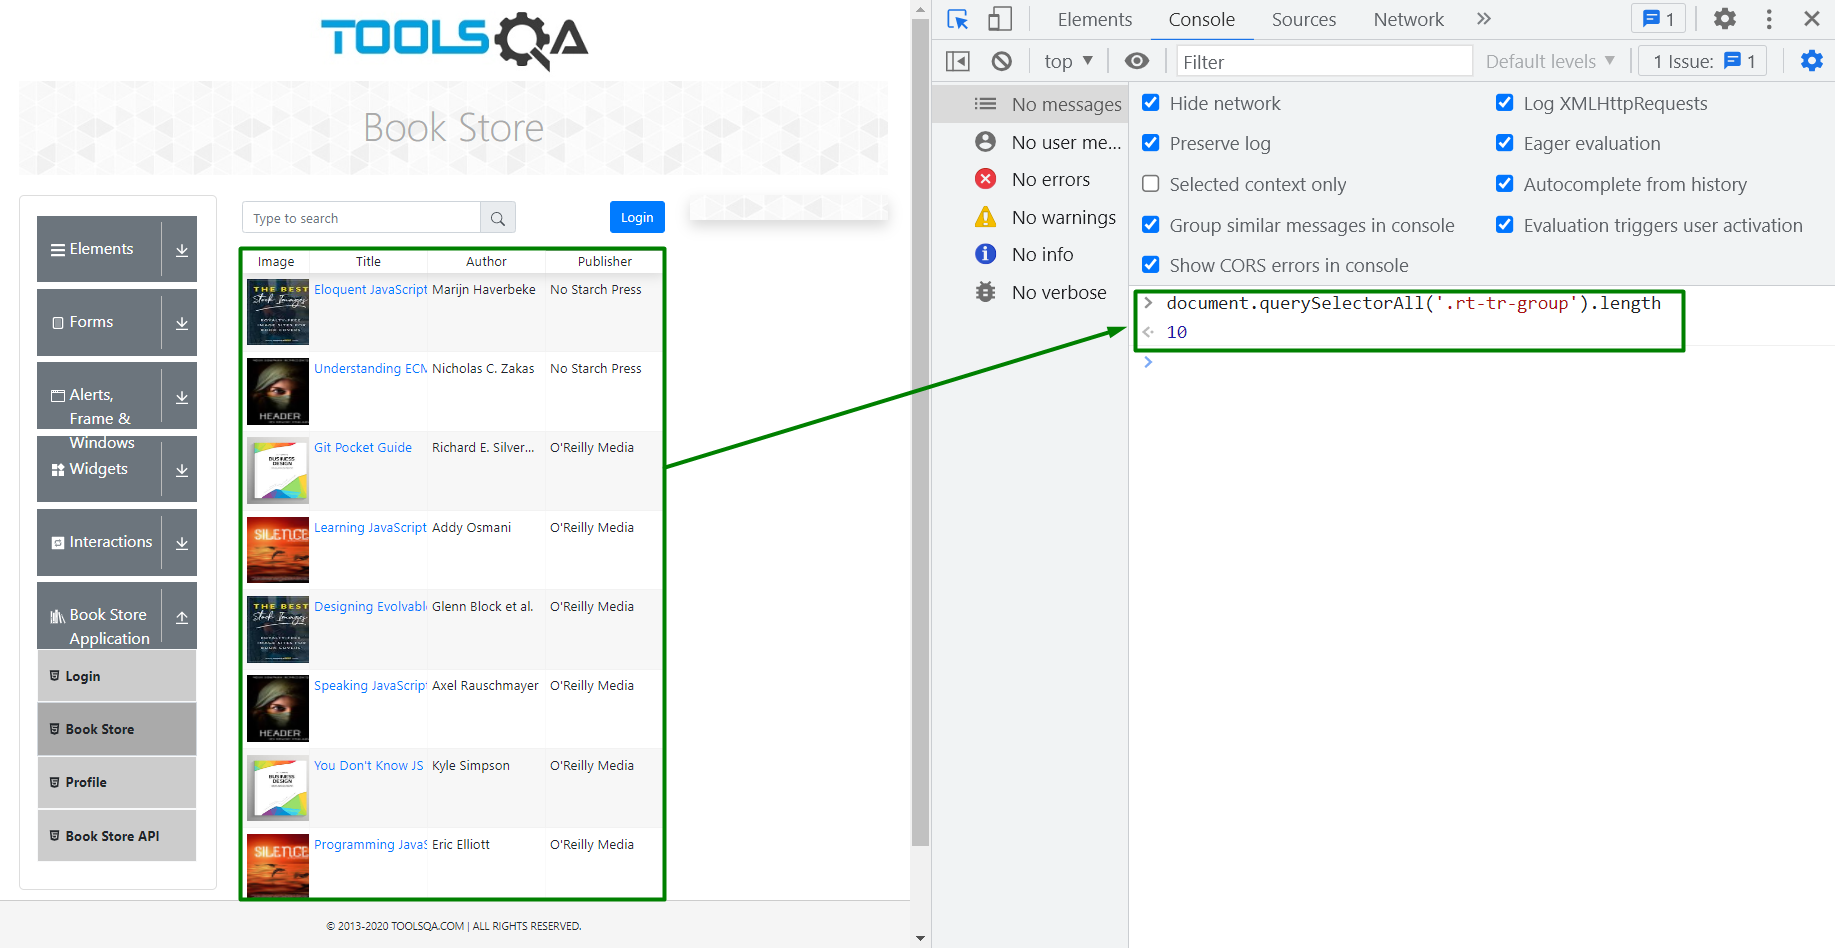
Explanation: document.querySelectorAll() method select all the elements on the page with the class name .rt-tr-group, which correspond to the rows in the table of books. The .length property count the number of elements that match this selector, which gives us the total number of cards with books on the page.
Click on button to open/hide console sidebar where messages are sorted by groups. It is possible to filter logs by keywords and levels or set available options in the Console settings
. Press
to clear the list of statements.
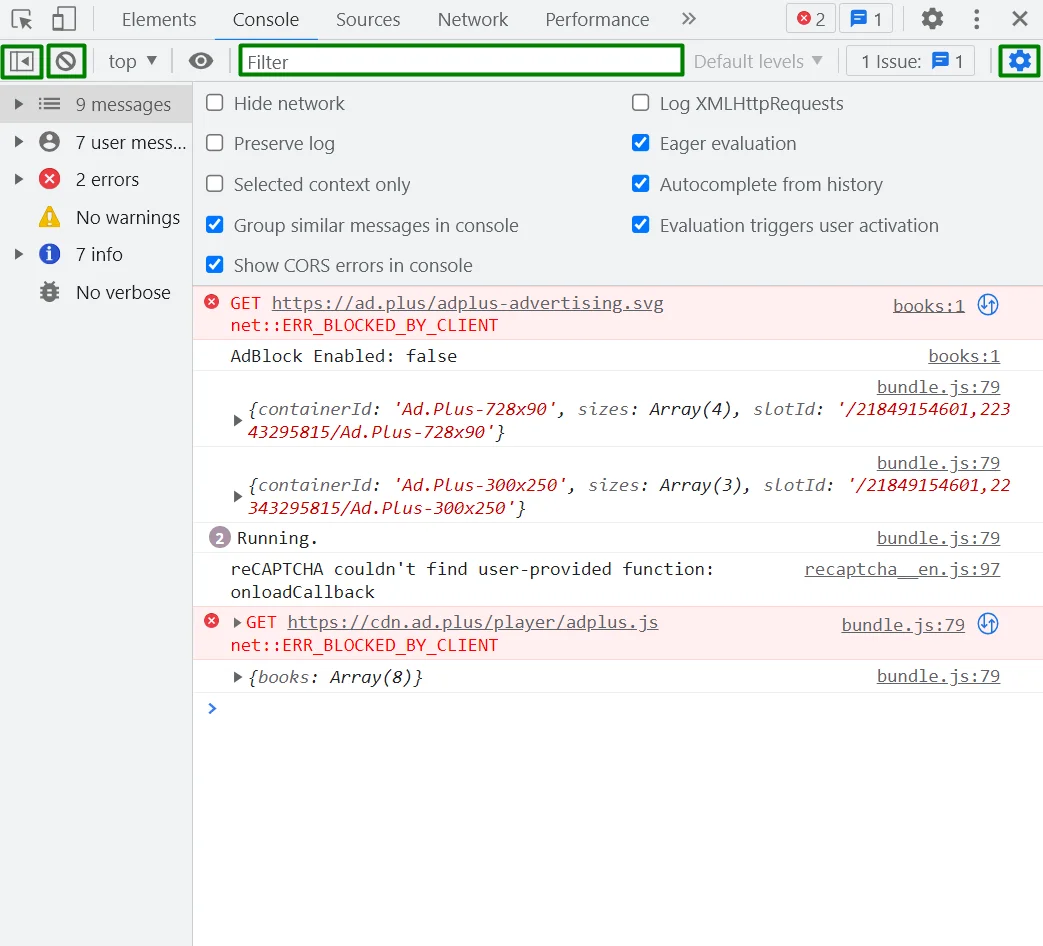
Create live expression by clicking on button.
Sources tab
Developers use this tab to view the files list that the page has uploaded, edit CSS and JS, debug code and run snippets.
Open “Page” to see a list of resources. Click on one of them to inspect and edit code in the additional window. CSS changes will be reflected on the web page immediately. For JS changes implementation use shortcut Control+S/Command+S.
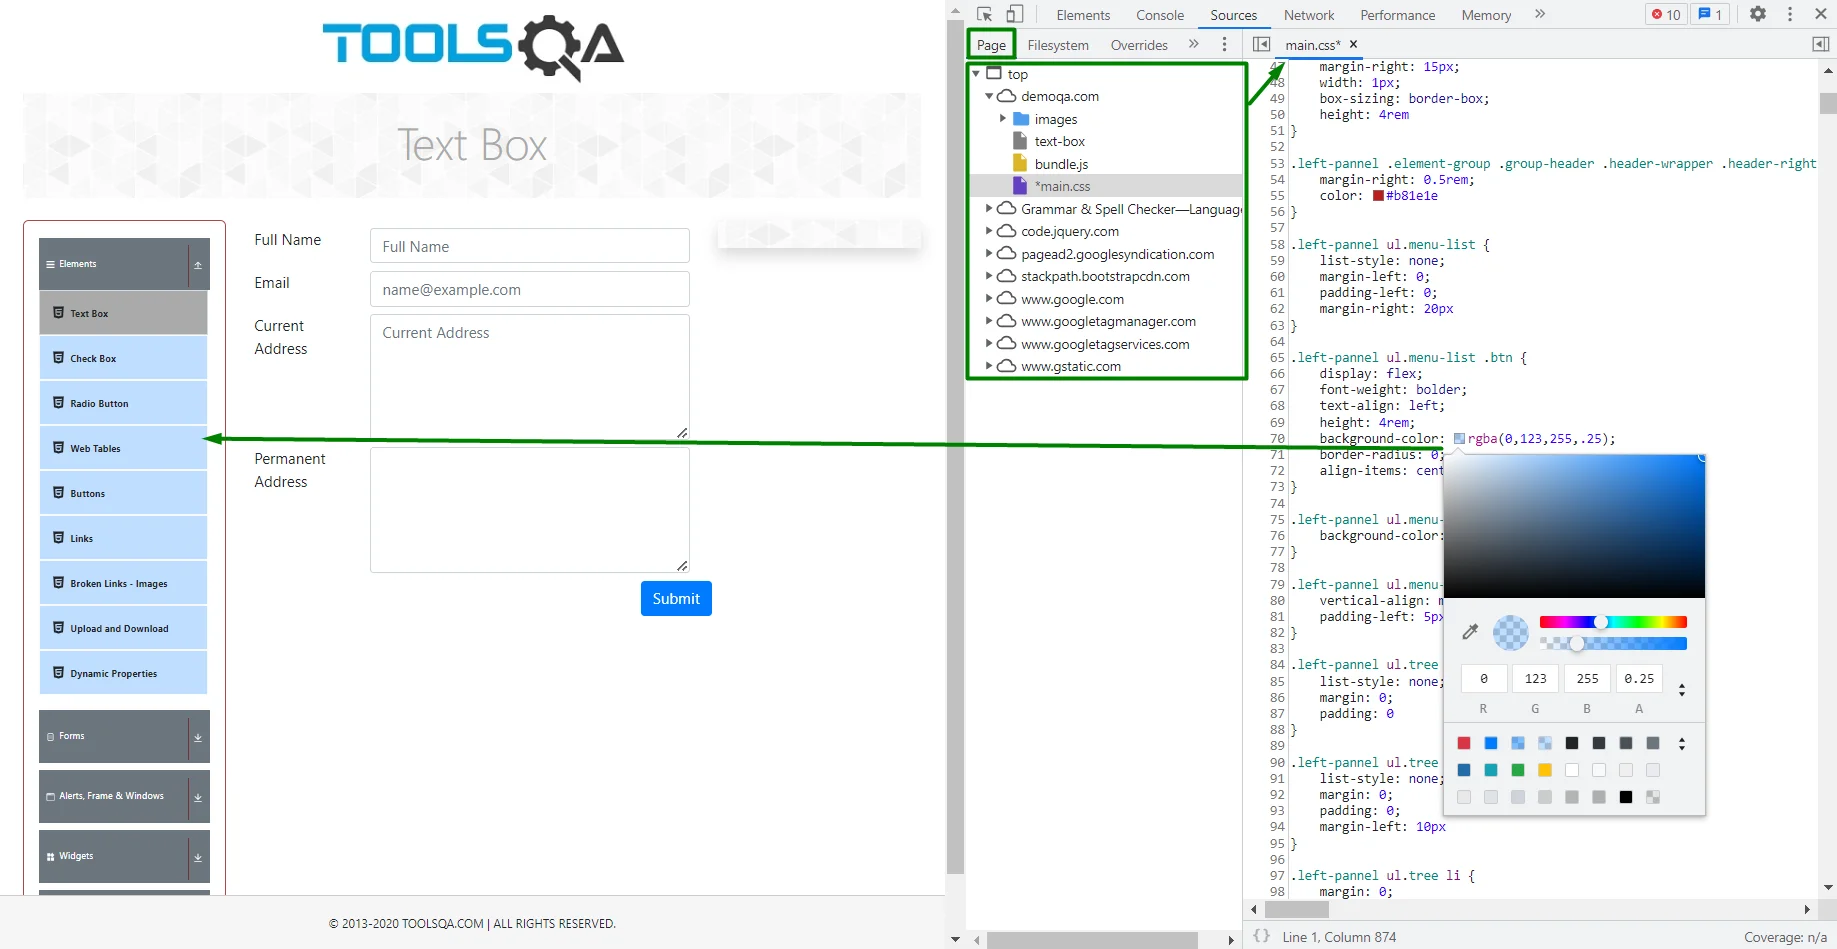
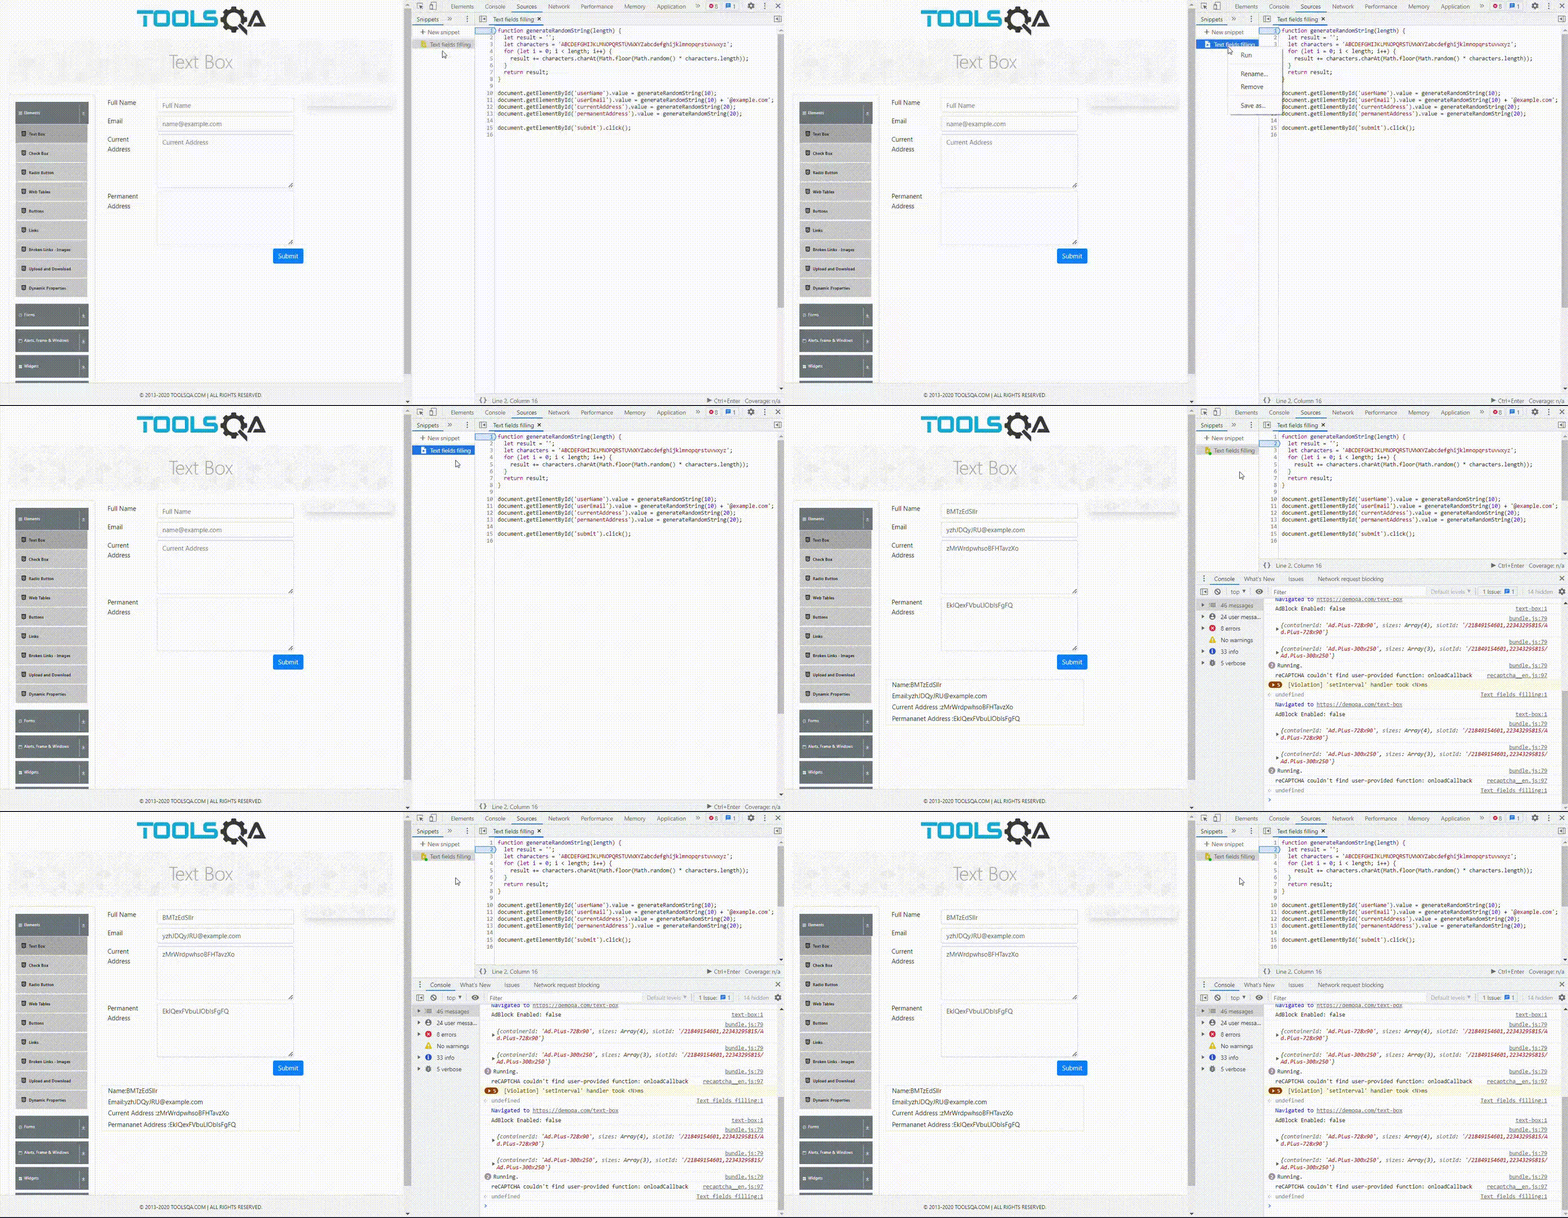
Create and run snippets in case you need to repeat the same actions many times on different pages. Short instruction: open “Snippets” tab → click on button → change name (optional) → write you script → right-click on your snippet → select “Run” option.
Simple example of snippet running
Below is an example of how, using a script, text fields are filled with random valid values and the “Submit” button is clicked.
Network tab
In this tab are displayed all resources loaded by the page after opening DevTools, along with diagnostic information. All data can be filtered by string, regular expression, property or resource type.

Click on button if you want to clear the list of requests. This button
can stop the recording of network log, but this checkbox
won’t clear log on page reload/navigation.
Simulate a slower network connection to test the website’s behavior under low loading speed. Sometimes, this feature helps check whether such elements, as loader for example, appear when data is being uploaded.

The tools panel also has special buttons for sharing network logs as HAR file. Use button to Import HAR and
to Export HAR.
Click on some request to inspect a resource’s details. Short guide:
- Headers tab for HTTP response headers inspection. Use
to search specific
- Payload tab for requested quaries
- Preview tab for responses analysis.
- Response tab also for responses but in the JSON format.
- Timing tab for evaluation of resources activities.
- Cookies tab for displaying the cookies sent in a request’s HTTP header.
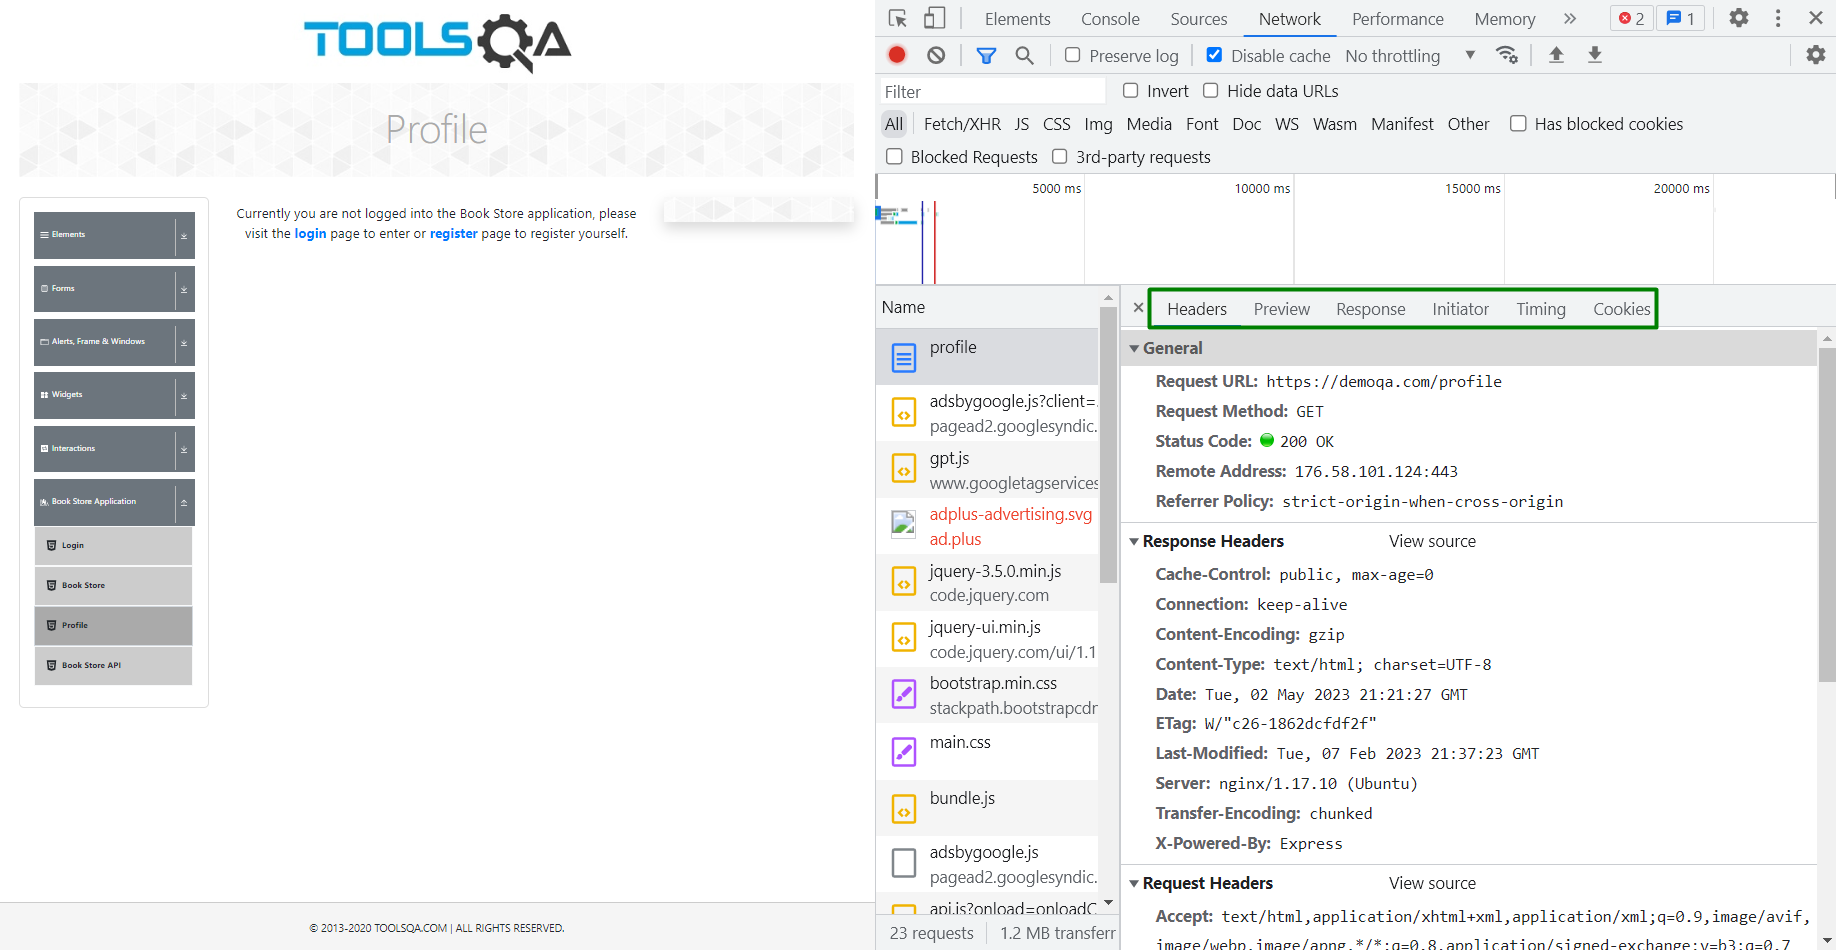
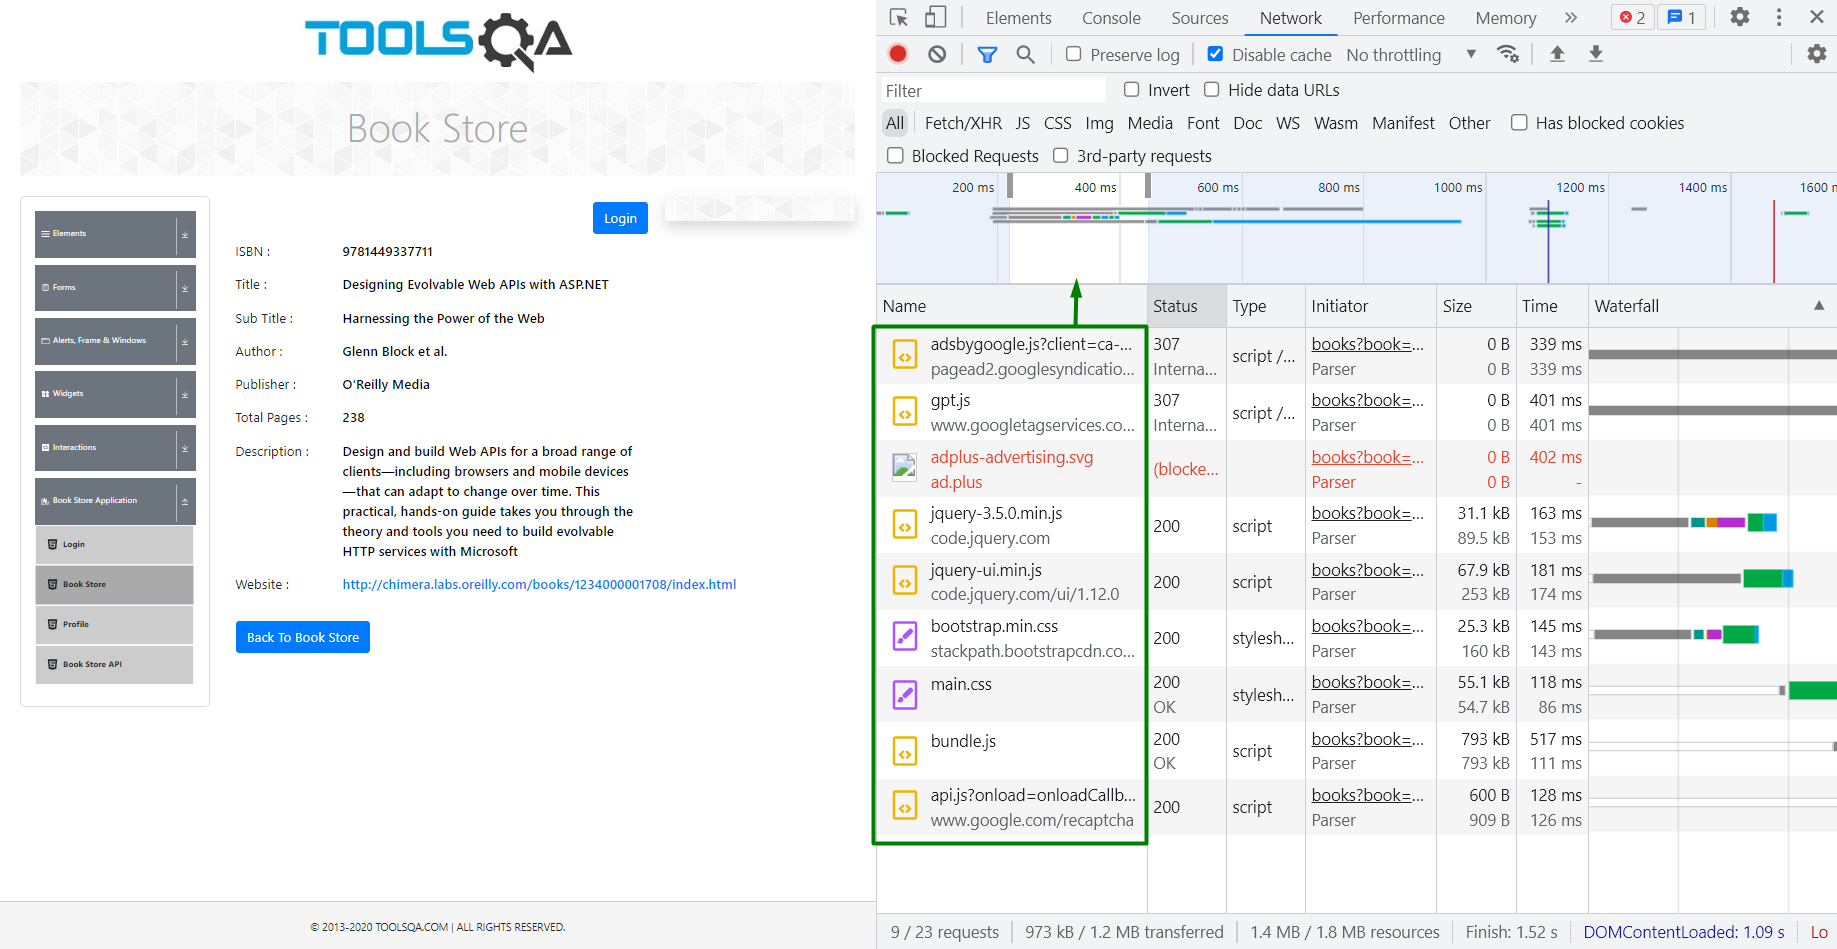
One of the useful Chrome DevTools tips and tricks is to use the “Network” tab for tracking and optimizing the loading time of your website. Requests duration is displayed on the time panel. Сlick and drag left or right on it to filter network logs by particular interval.
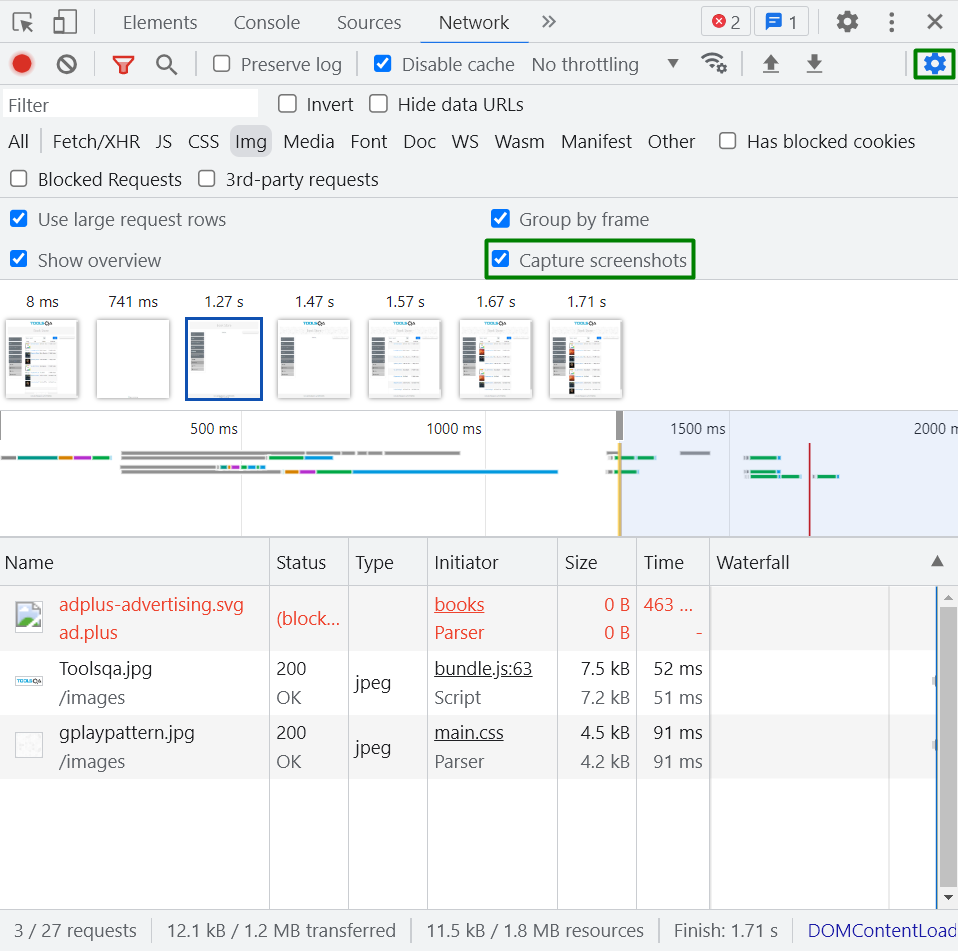
Analyzing page loading by sequential screenshots can also help in certain situations. Just click on button and check
option. Screenshots will appear after some actions on the website. Click on one of them to filter requests and highlight duration on the time panel.
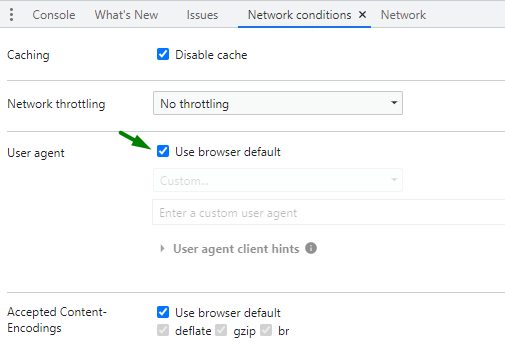
In the “Network conditions” tab it is possible to change the value of the “User-Agent” HTTP header that is sent with the request. In this way, you can conduct a cross-browser and multi-platform check of the website.
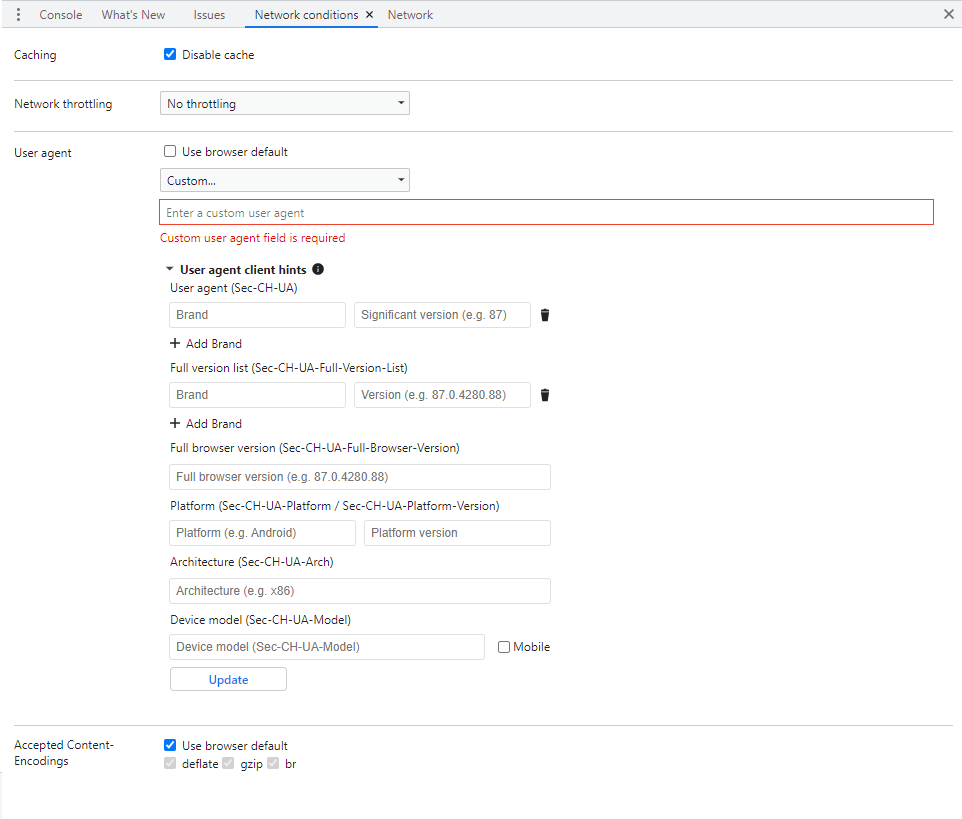
Set user agent client hints if necessary.
And last but not least, developers can block requests to test error scenarios (for example, stub displaying instead of image) or evaluate their impact on performance. Text pattern can be edited with using the wildcard character * to widen the scope of the URL expression.

Performance tab
Use Performance tab to analyze website performance during page runtime or loading. To start recording in the first case, click on button, in the second case, click on
button. Check
option to investigate loading by screens. Press
to import profile or click on
to export it.
Add additional properties in the Settings , for example emulate hardware concurrency to check page performance with different numbers of processor cores.
Memory tab
This tab is created for fixing memory problems including leaks, bloats and garbage collections. Chrome DevTools offers to select one of three profiling types:
- heap snapshot (displays the distribution of memory usage among the JavaScript objects and associated DOM nodes in your webpage);
- allocation instrumentation on timeline (exhibits the memory allocations of instrumented JavaScript code throughout a specific period, good for isolating memory leaks);
- allocation sampling (compare periodic snapshots of the JavaScript heap to identify where memory was allocated and deallocated).
If you want to quickly obtain information about the memory usage of a web page, the best way is to take a heap snapshot (click on button or press
), which is initially stored in the memory of the renderer process. When you want to view the snapshot, it can be transferred to DevTools upon request.
Profiles data has three perspectives:
- Summary: it is a table containing the constructors and their associated objects (grouped by size, distance and the number of objects retained).
- Comparison: used to identify differences between multiple snapshots (by default, this option compares the current snapshot to the previous one).
- Containtment: allows to examine heap contents, which are color-coded for easy analysis.
- Statistics: represents a circular chart illustration of the total memory amount used by each type of object.
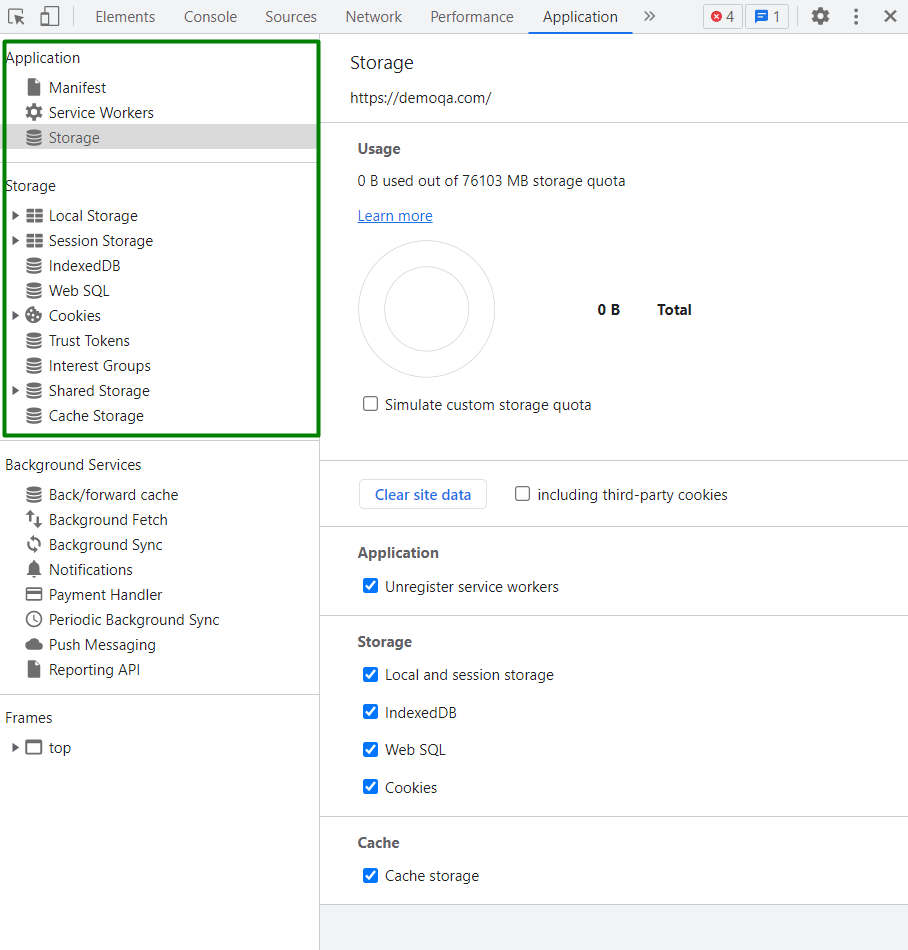
Application tab
In this tab developers can inspect, manipulate and fix issues with cached data, local storage, session storage and other resources associated with a web page.
Purpose of main options:
- Storage: use to manage the data in local storage, session storage, cookies, IndexedDB, Web SQL. If a user has saved his preferences or login information on a website using local or session storage, clearing the storage will remove that data and the user will need to enter login information again.
- Cache: use to get information about the cached data, including HTML, CSS, JavaScript, images and other types of files.
- Manifest: use to get access to the web page’s manifest file, which specifies metadata about the application, including its name, icons and other properties.
- Service Workers: use to reach a script that runs in the background and provides advanced caching, offline functionality and other features.
Security tab
This tab demonstrates the security overview of an opened web page.
“This page is secure (valid HTTPS)” notification means that connection is protected. Click on button to view the main origin’s certificate.
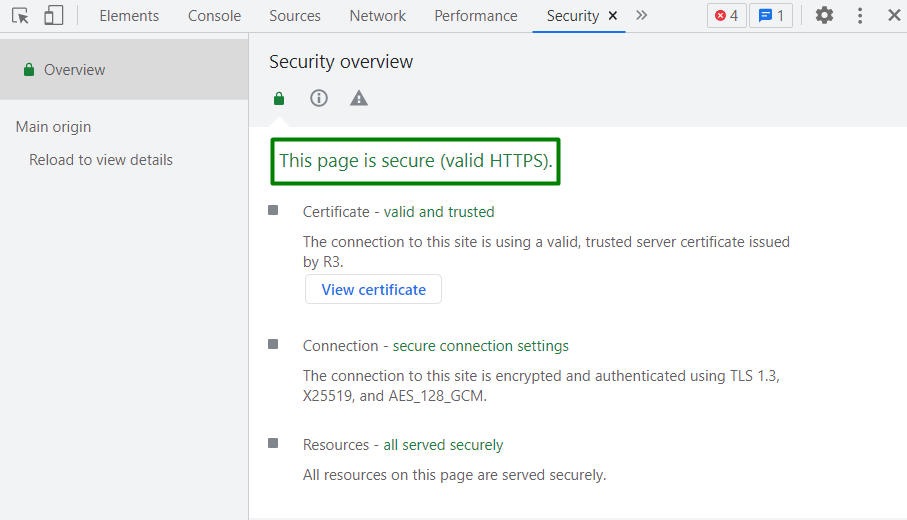
In case when main origin of a page is not secure, “This page is not secure” message appears.
Mixed content refers to a situation where a webpage’s main origin is secure (using HTTPS), but the page requests resources from non-secure origins (using HTTP). When a page contains mixed content, it is only partially protected, as the non-secure HTTP content can potentially be intercepted by attackers, making it vulnerable to sniffers and man-in-the-middle attacks.
Lighthouse tab
DevTools provides the option to generate a Lighthouse report by clicking on button, which contains detailed information and recommendations regarding a website’s performance, accessibility and search engine optimization (SEO).
Lighthouse is a highly extensible tool that can be customized in several ways to fulfill the specific needs of customers. One way is to use configuration settings, another way is through the use of plugins or custom audits. Lighthouse also provides an API that allows developers to automate audits and integrate Lighthouse into their continuous integration and deployment pipelines.
Recorder tab
Currently Recorder it is a feature under development, but even now you can use it for recording, replaying and measuring user flows on the webpage. Click on button to initiate new record. Press
during inspection to replay trace steps and select available options to change speed of reproducing.
Performance insights tab
It is one more under development feature in DevTools for investigating website’s runtime performance and getting implementable overview (“Insights” tab). Set Network and CPU throttling before measuring the page load. After measuring, select a trace event in the timeline to view its details (“Details” tab) and recommendation for improvements.
Press to replay your record. Click on
panel button to import profile or
to export it.
Connect with WebbyLab professionals and turn your ideas into reality
Get a consultationHow to debug on a tablet?
In general, all Android devices can be remotely debugged directly from the Chrome browser on your computer (Windows OS/macOS/Linux OS).
To do this, you need to perform the following steps:
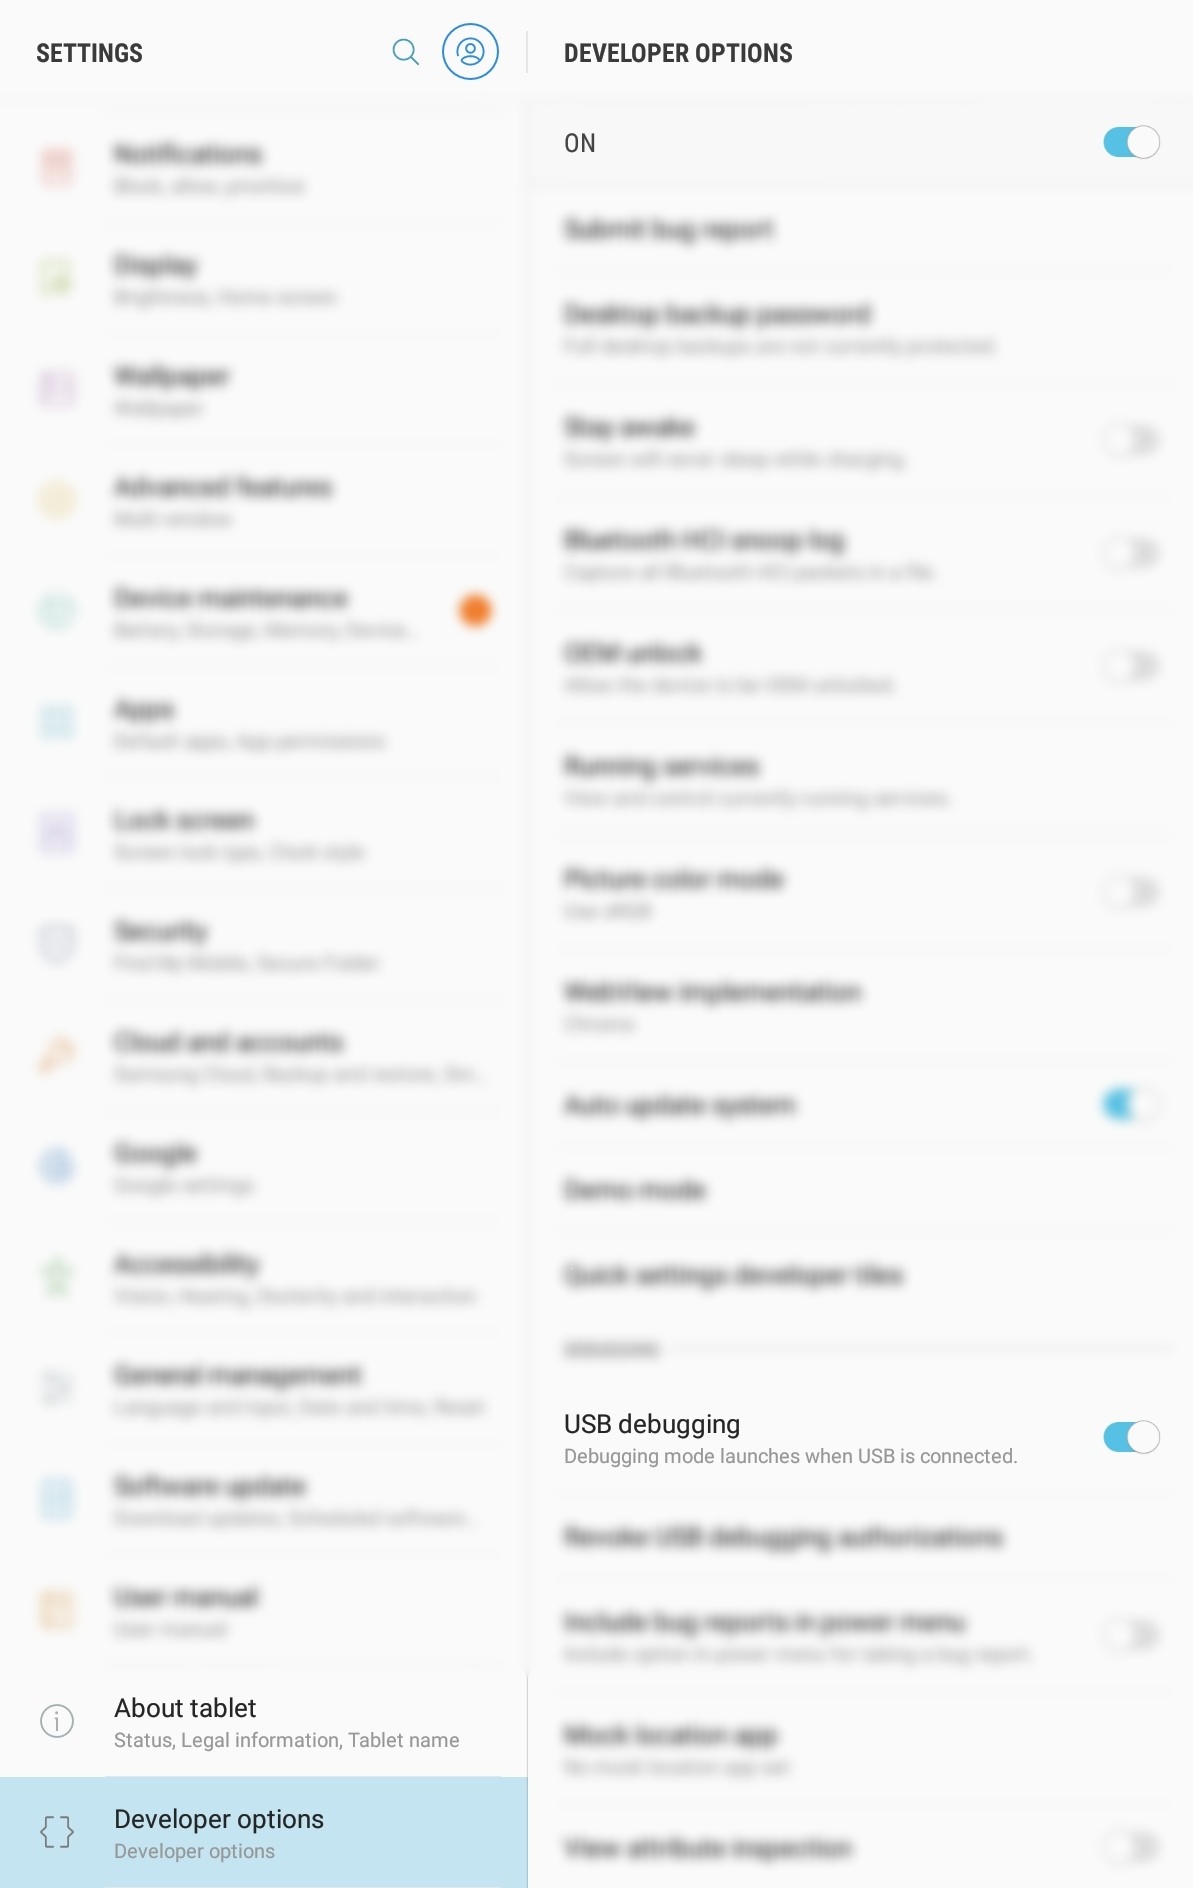
- Enable “Developer options” and “USB debugging” on your tablet or another Android device.
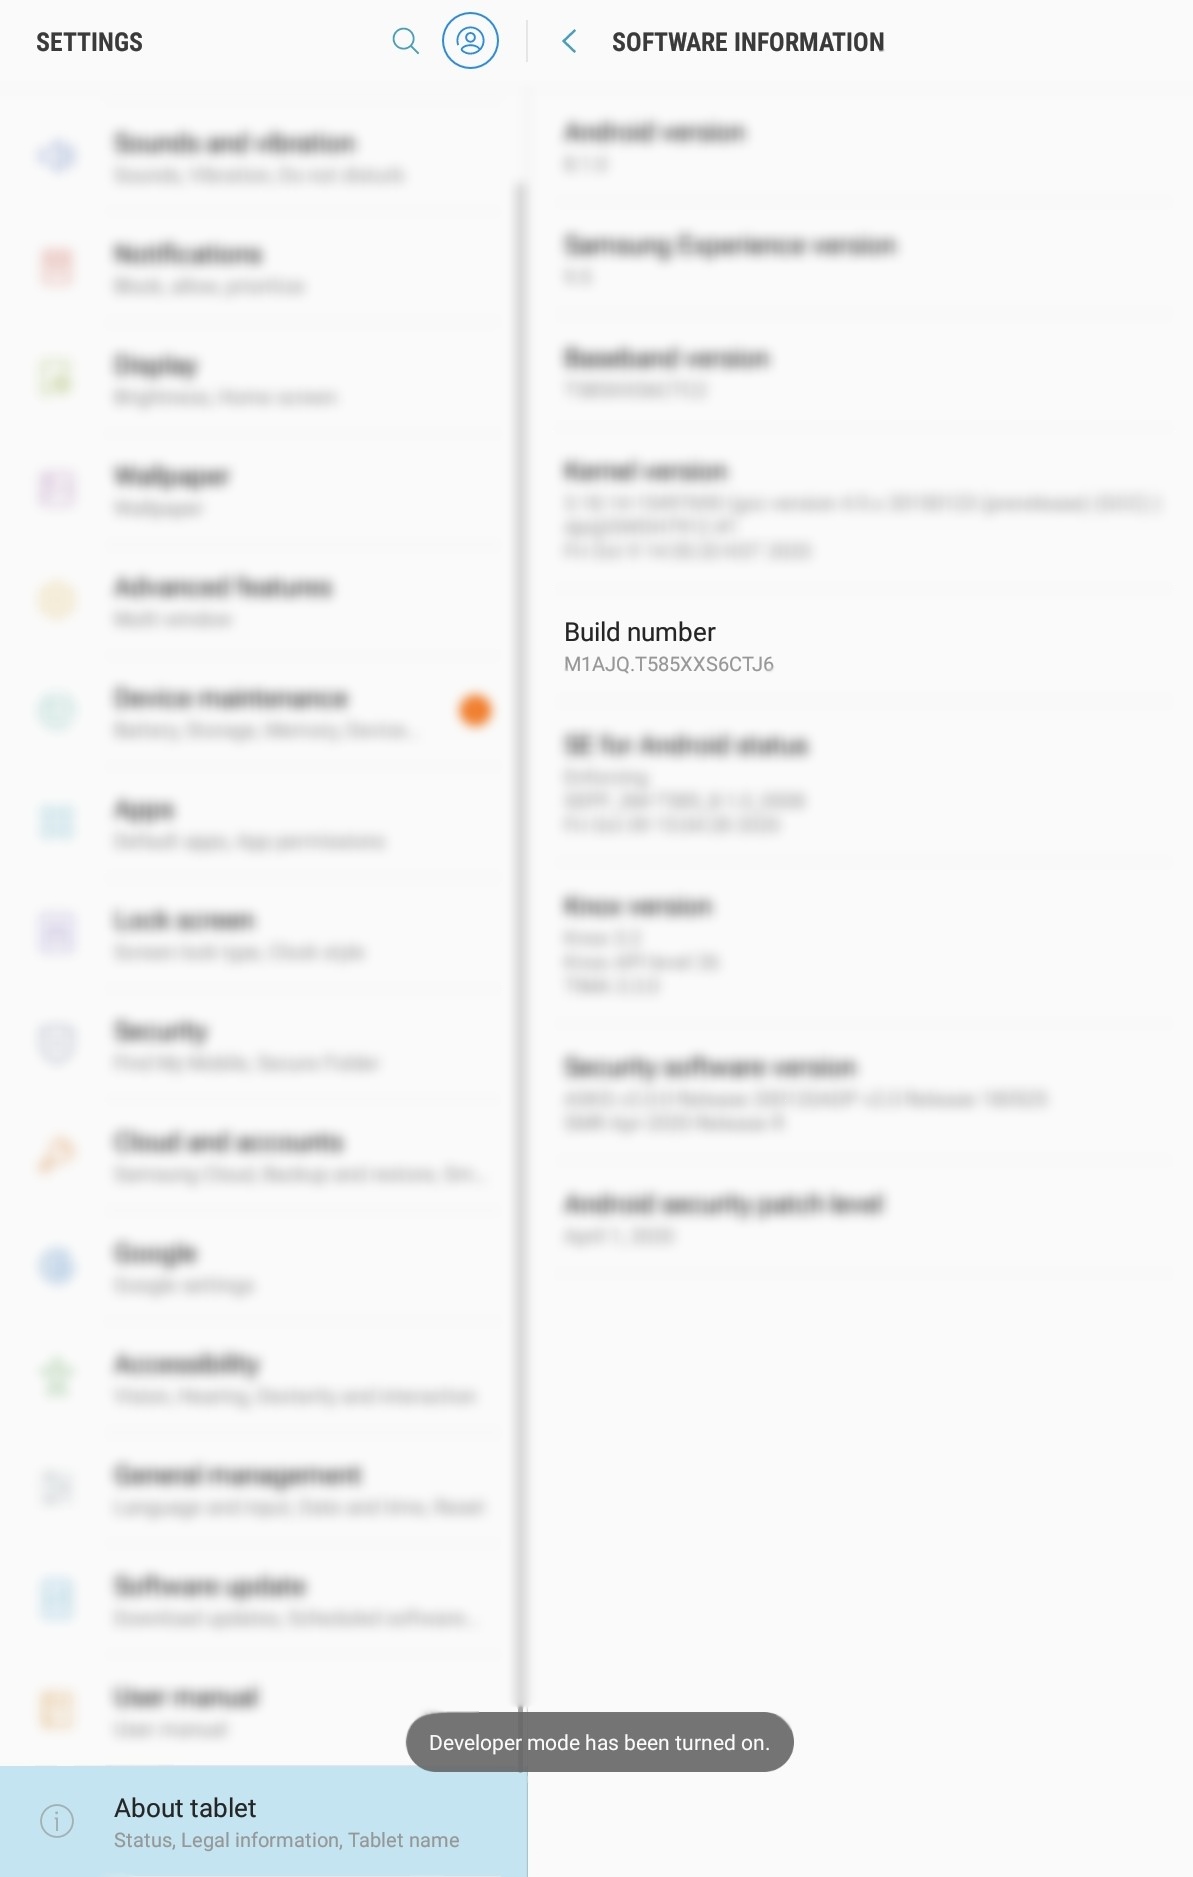
In order to open “Developer options” go to “Settings” → “About tablet” → “Software information” → “Build number” → click on this option several times → message “Developer mode has been turned on” appears.
*Note: names and path may vary on different devices.
Now find “Developer options” at the bottom of the “Setting” list → toggle “On” option → enable “USB debugging” option. These steps will help establish a connection between your device and the computer.
- Open chrome://inspect#devices in the Chrome browser on your computer.
- Verify if “Discover USB devices” option is checked.
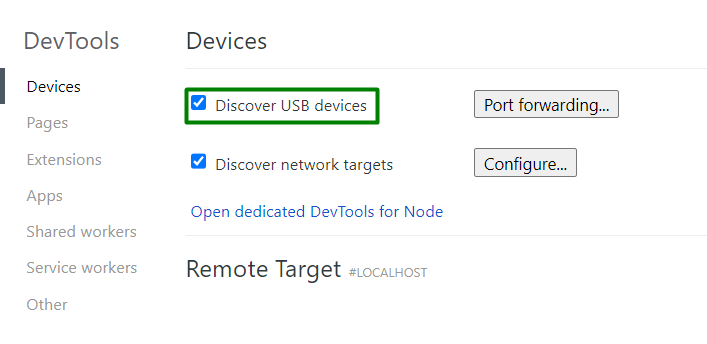
- Use a USB cable to connect the Android device to your computer. If any notifications appear on your tablet (or another device), allow to continue debugging. After that device name, serial number and running Chrome version should appears on “Devices” page opened on your computer.
- Open Chrome browser on your tablet (or another device) and visit page you want to debug. Also it is possible to open website automatically from your computer. Find according field on “Devices” page and enter URL
.
Regardless of the chosen method, the link to the webpage will be displayed on the “Devices” tab along with possible interaction options ![]() .
.
If your application is using WebView, you will also notice a separate section dedicated to it.
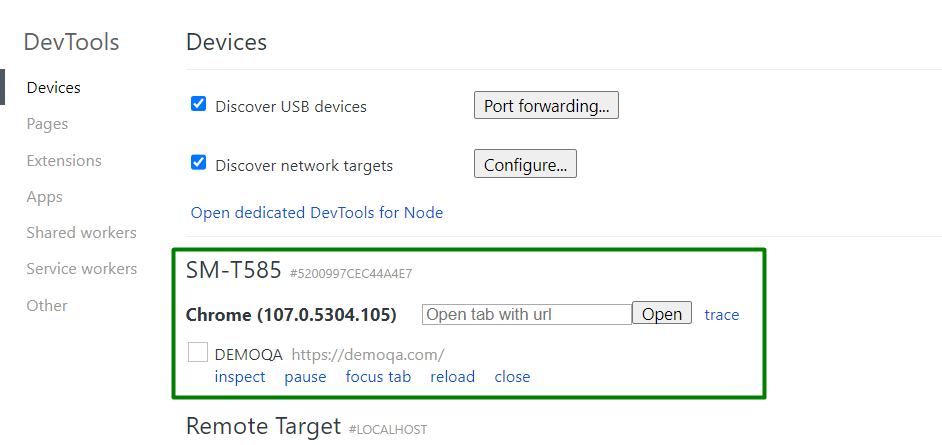
- Click on
button to open DevTools functionality.
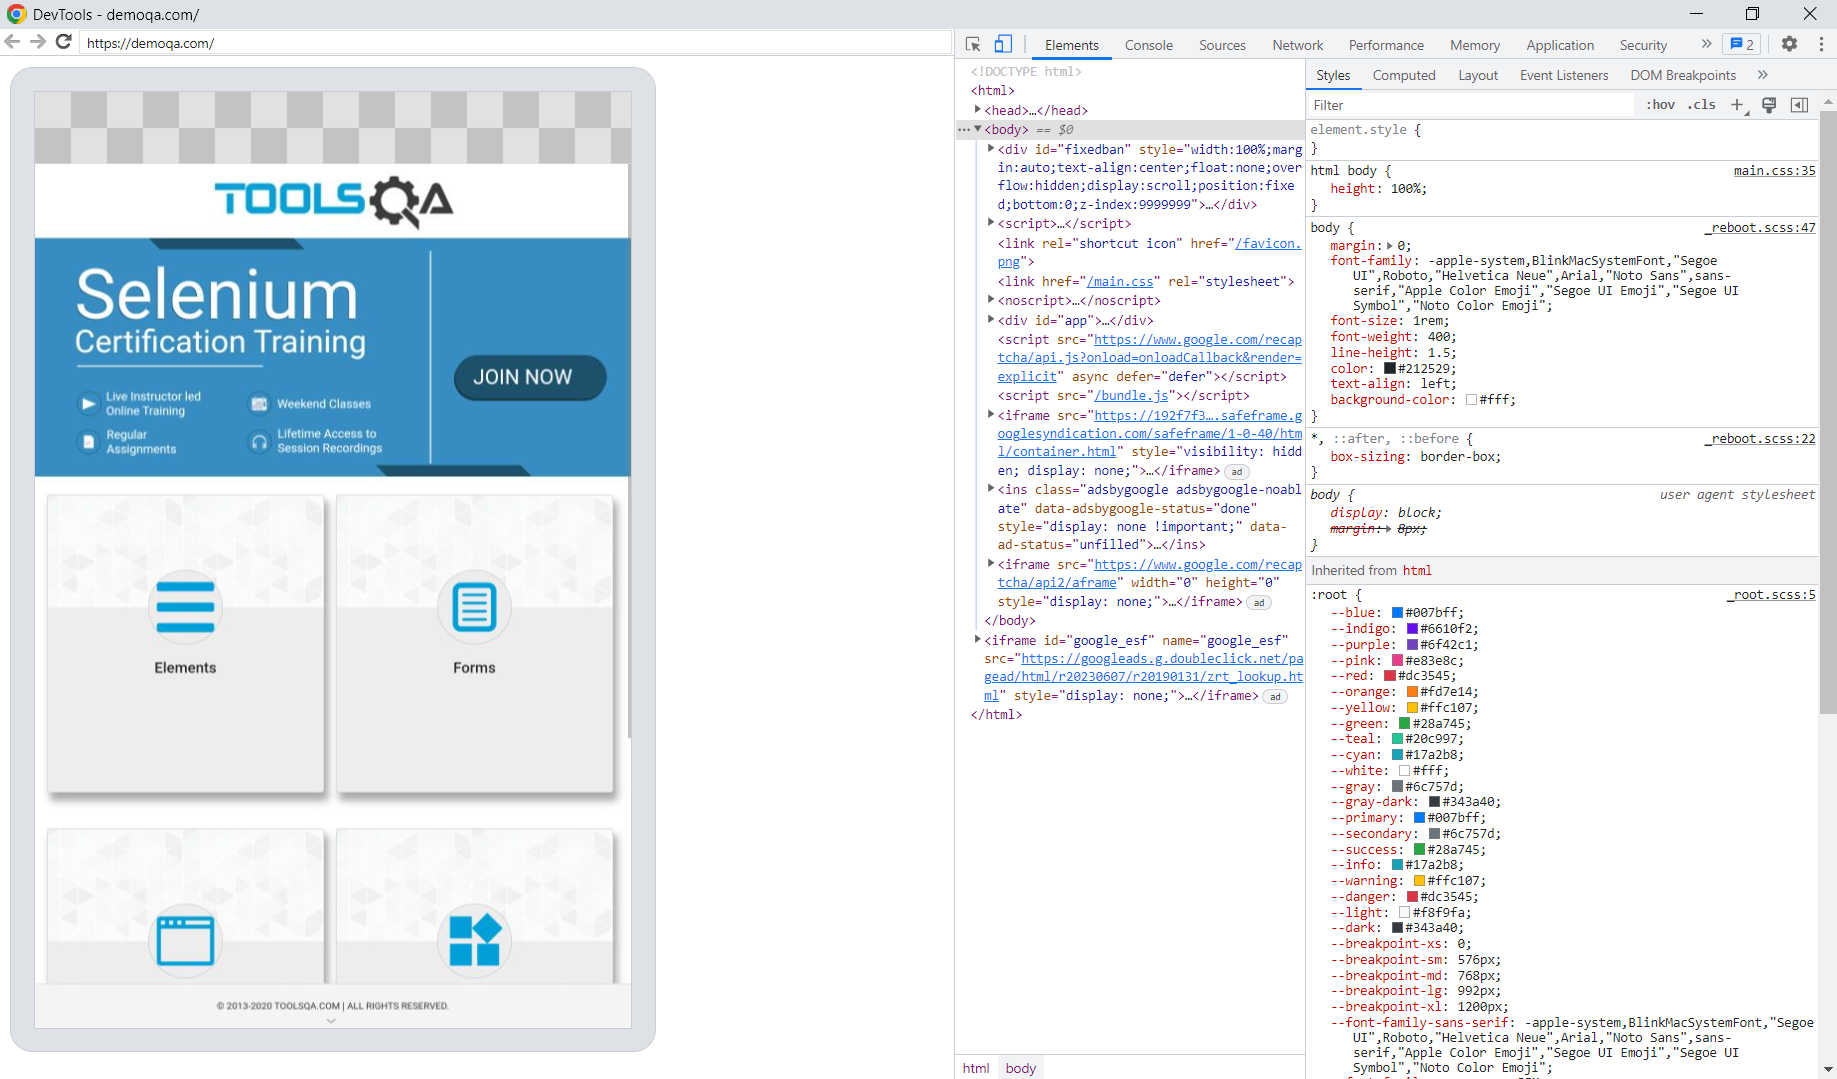
Computer screen
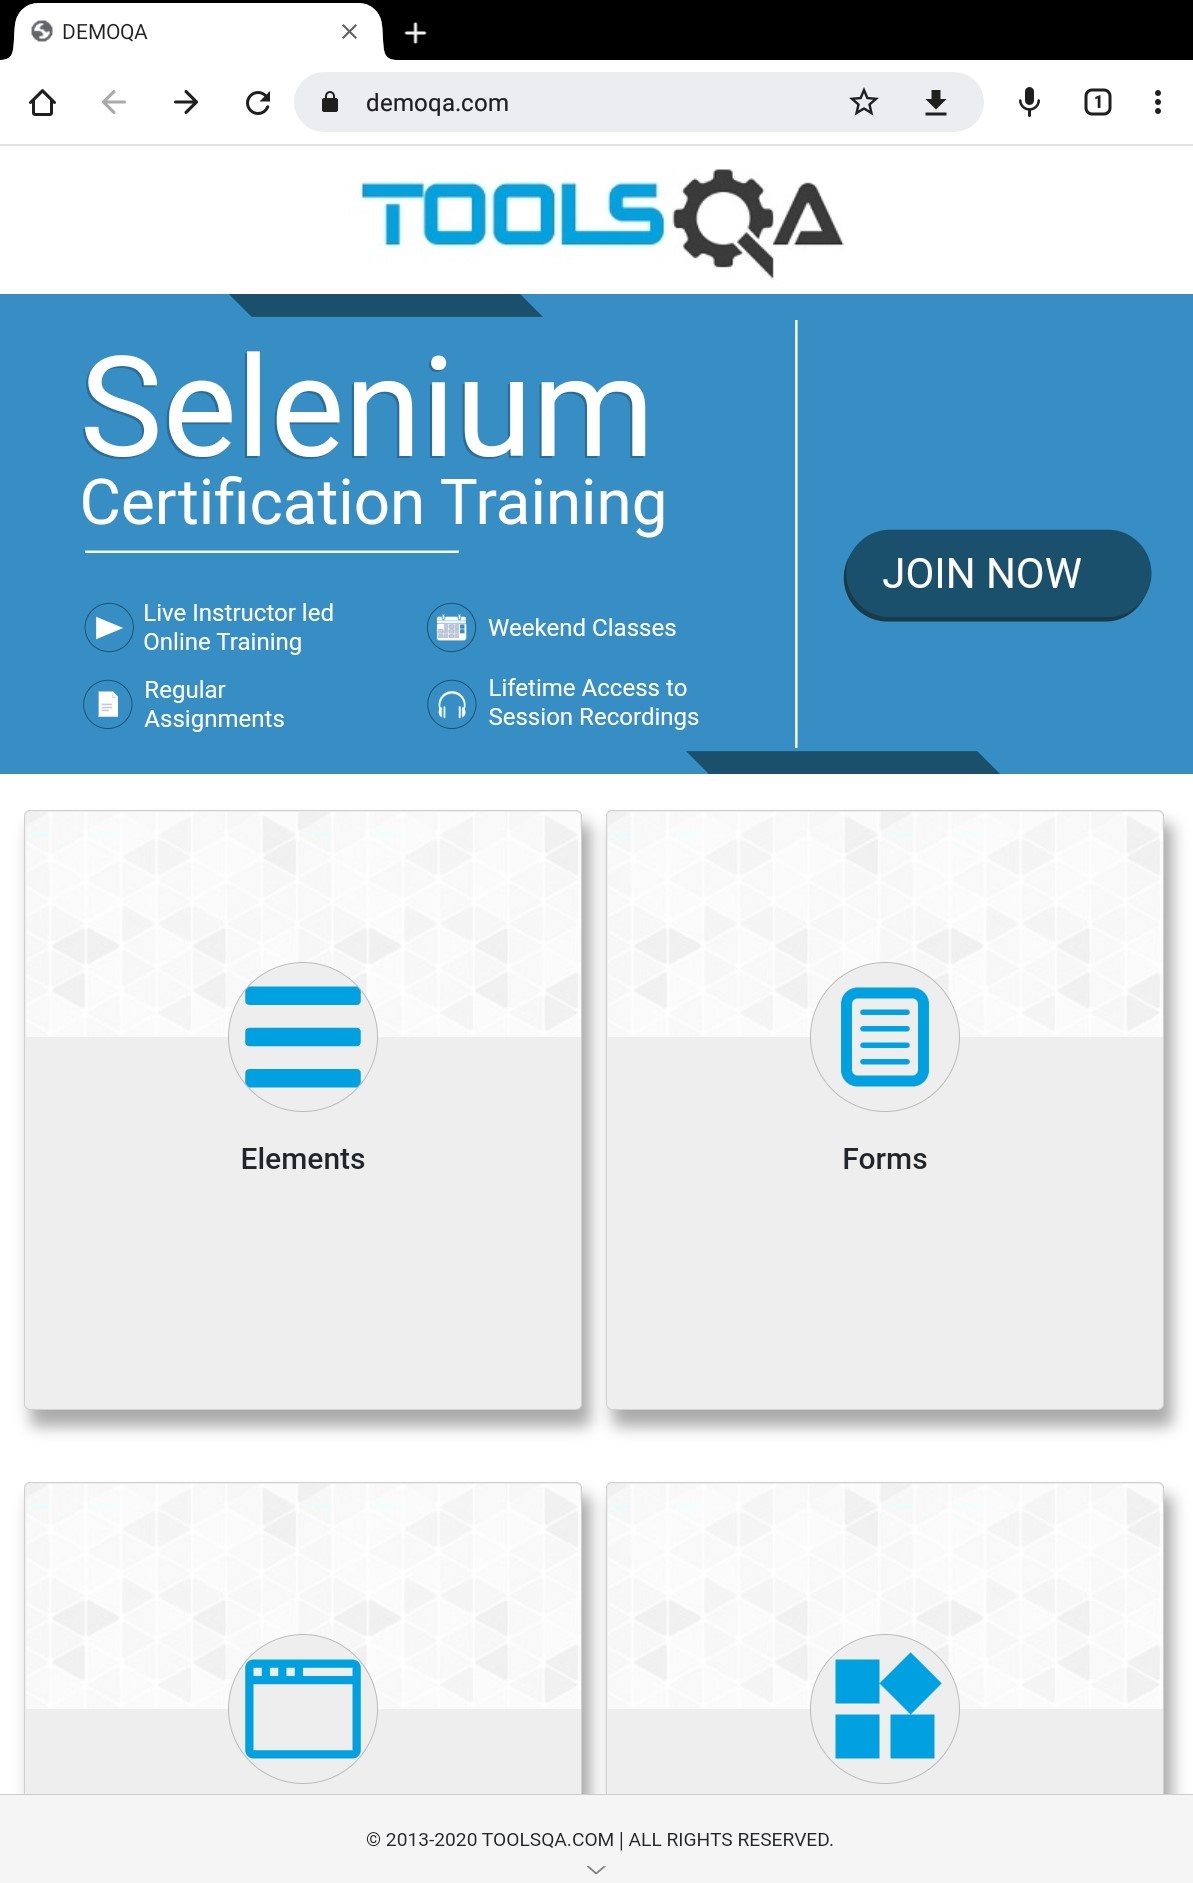
Tablet screen
Now you can remotely debug the website on your Android device from your computer using Chrome DevTools.
Manage screencast view with button. Use
button to work with elements.
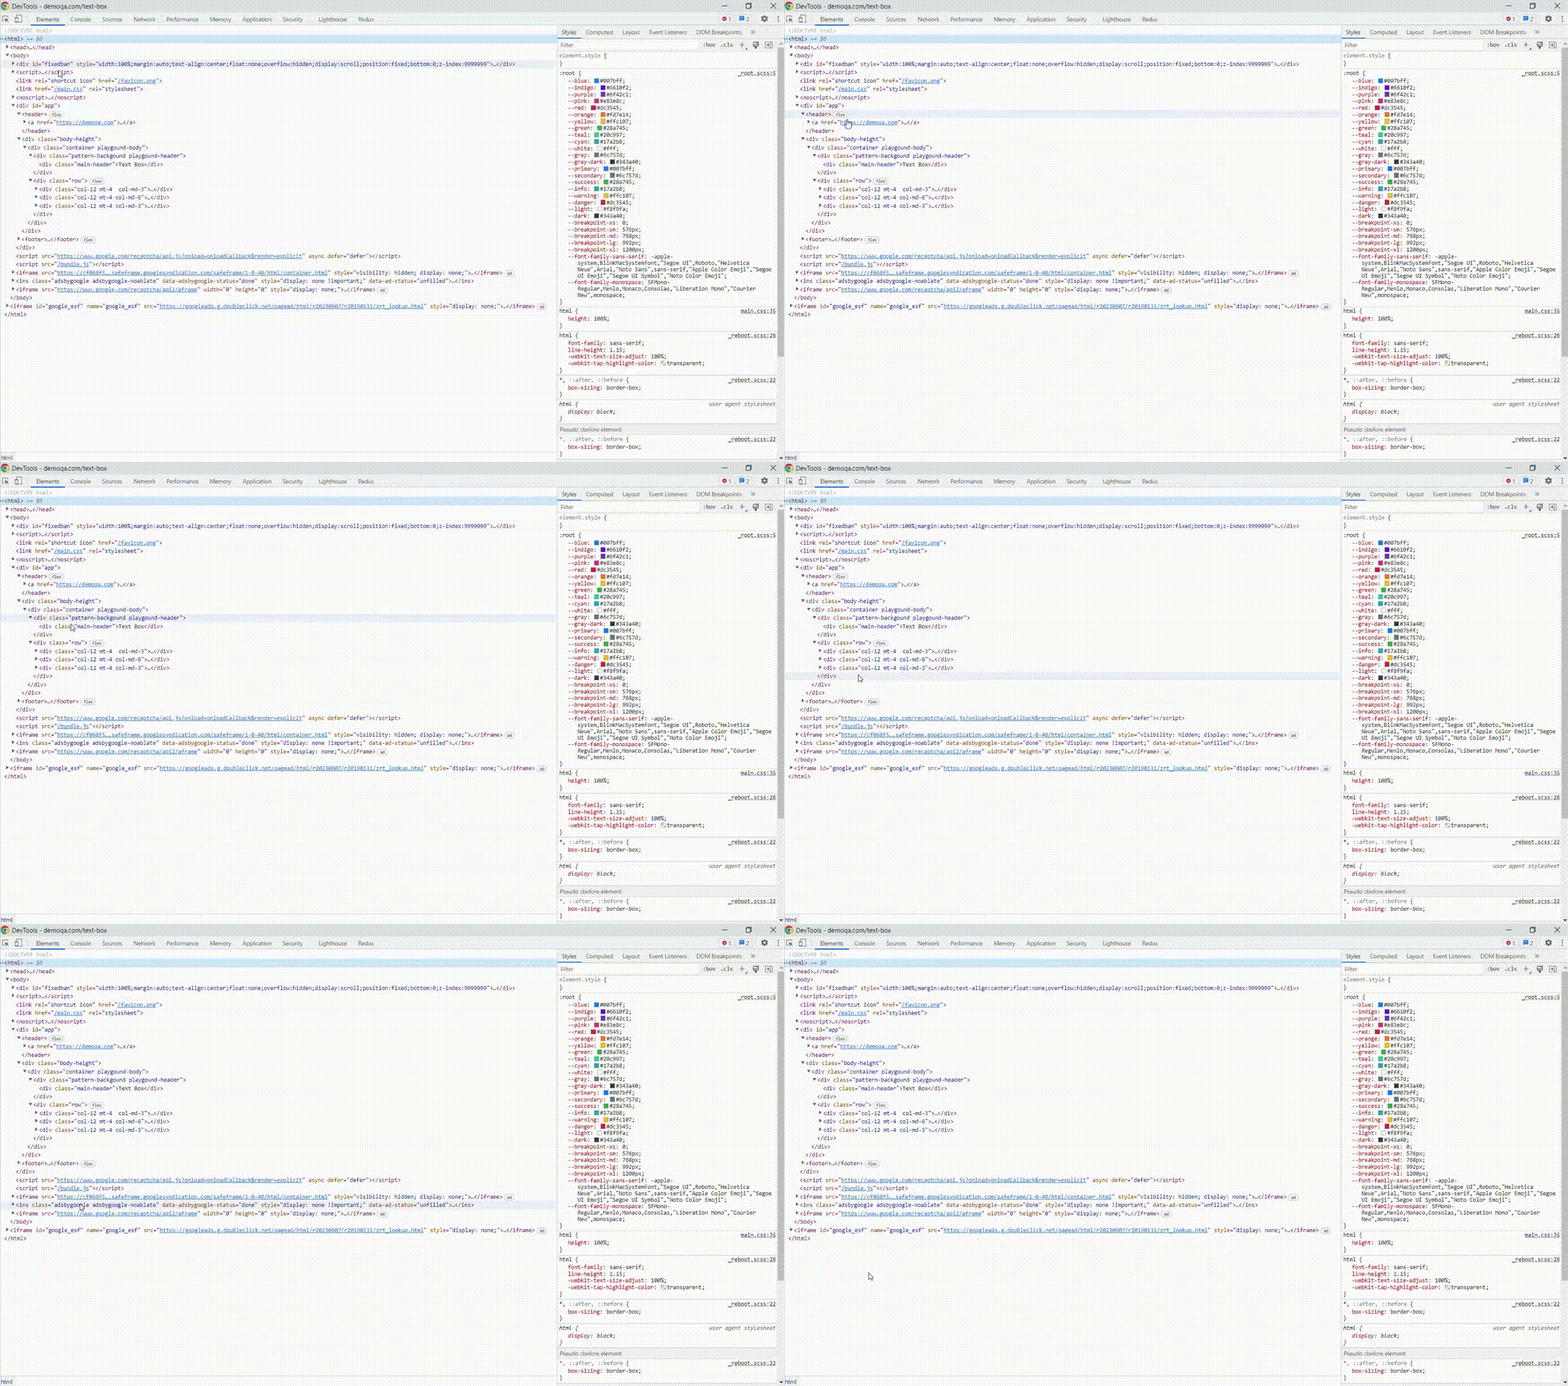
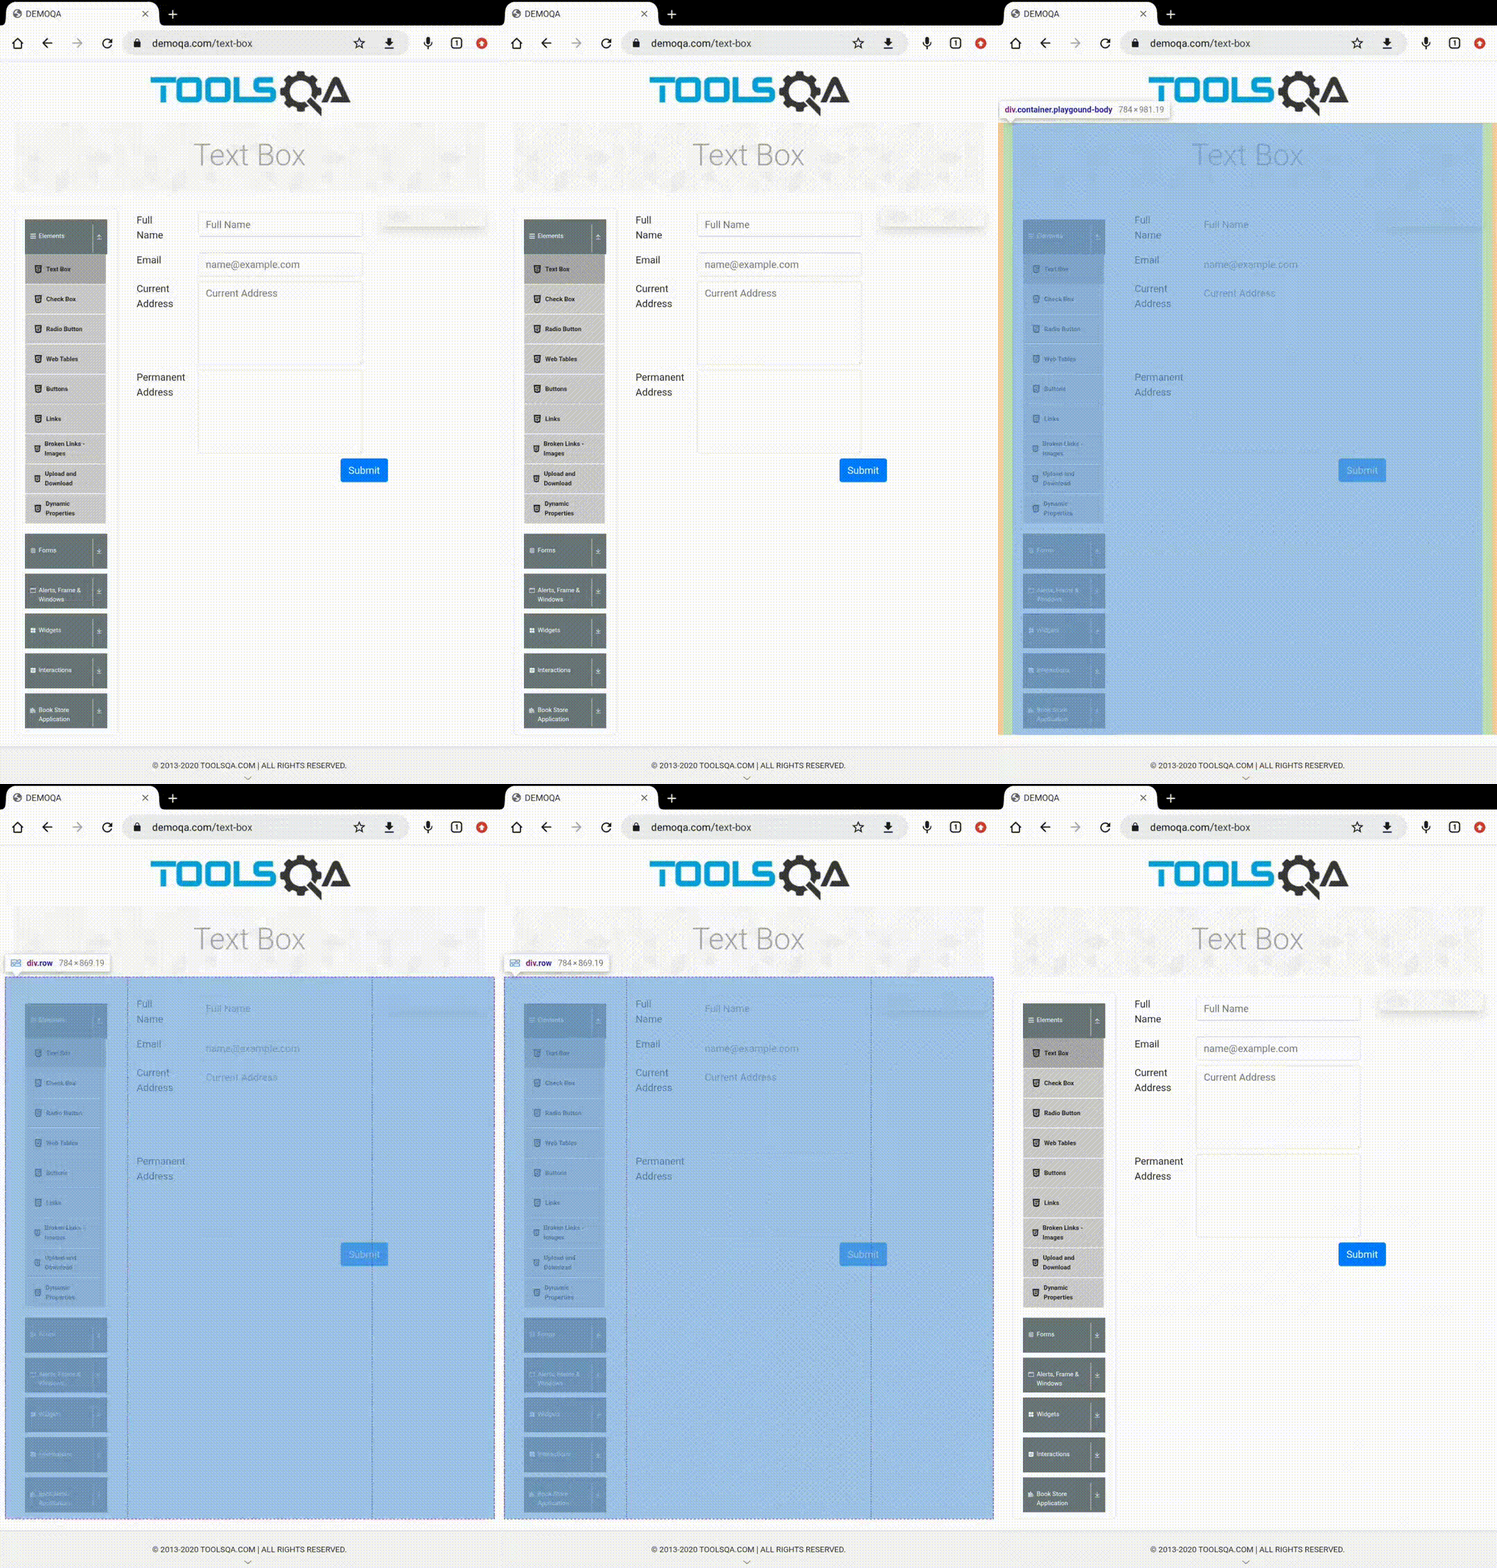
Example of actions in the “Elements” tab on the computer and their display on the tablet screen.
Computer screen
Tablet screen
Redux DevTools as example of custom extensions for Chrome DevTools
Custom extensions for DevTools allow developers to extend the functionality of default version. It is possible to add new features or modify existing ones for more productive debugging and developing of web applications.
If you are interested in this opportunity, then determine the scope of functionality you want to add and use suitable technology stack to write the code. Once your extension is complete, package it into a file format that can be easily installed and used by you and other developers.
Redux DevTools is an example of extension for Redux applications that allows developers to inspect and debug the state of their Redux store, step backwards and forwards through the changes made over time and track performance. This can be particularly beneficial for debugging platform that have large and intricate state trees.
In the Redux DevTools also are included various features such as the ability to log actions, export and import state. This tool can help developers identify performance issues and optimize the performance of their app.
In addition to Redux, it can also be utilized with any other architectures which handle the state.
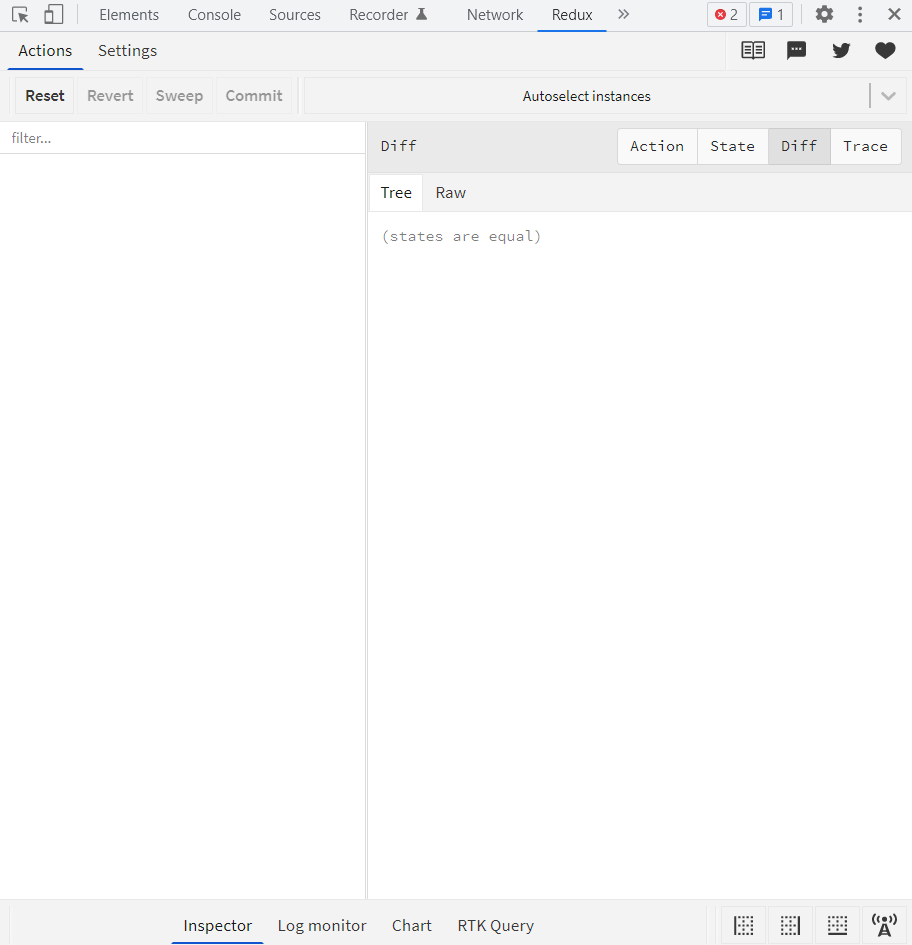
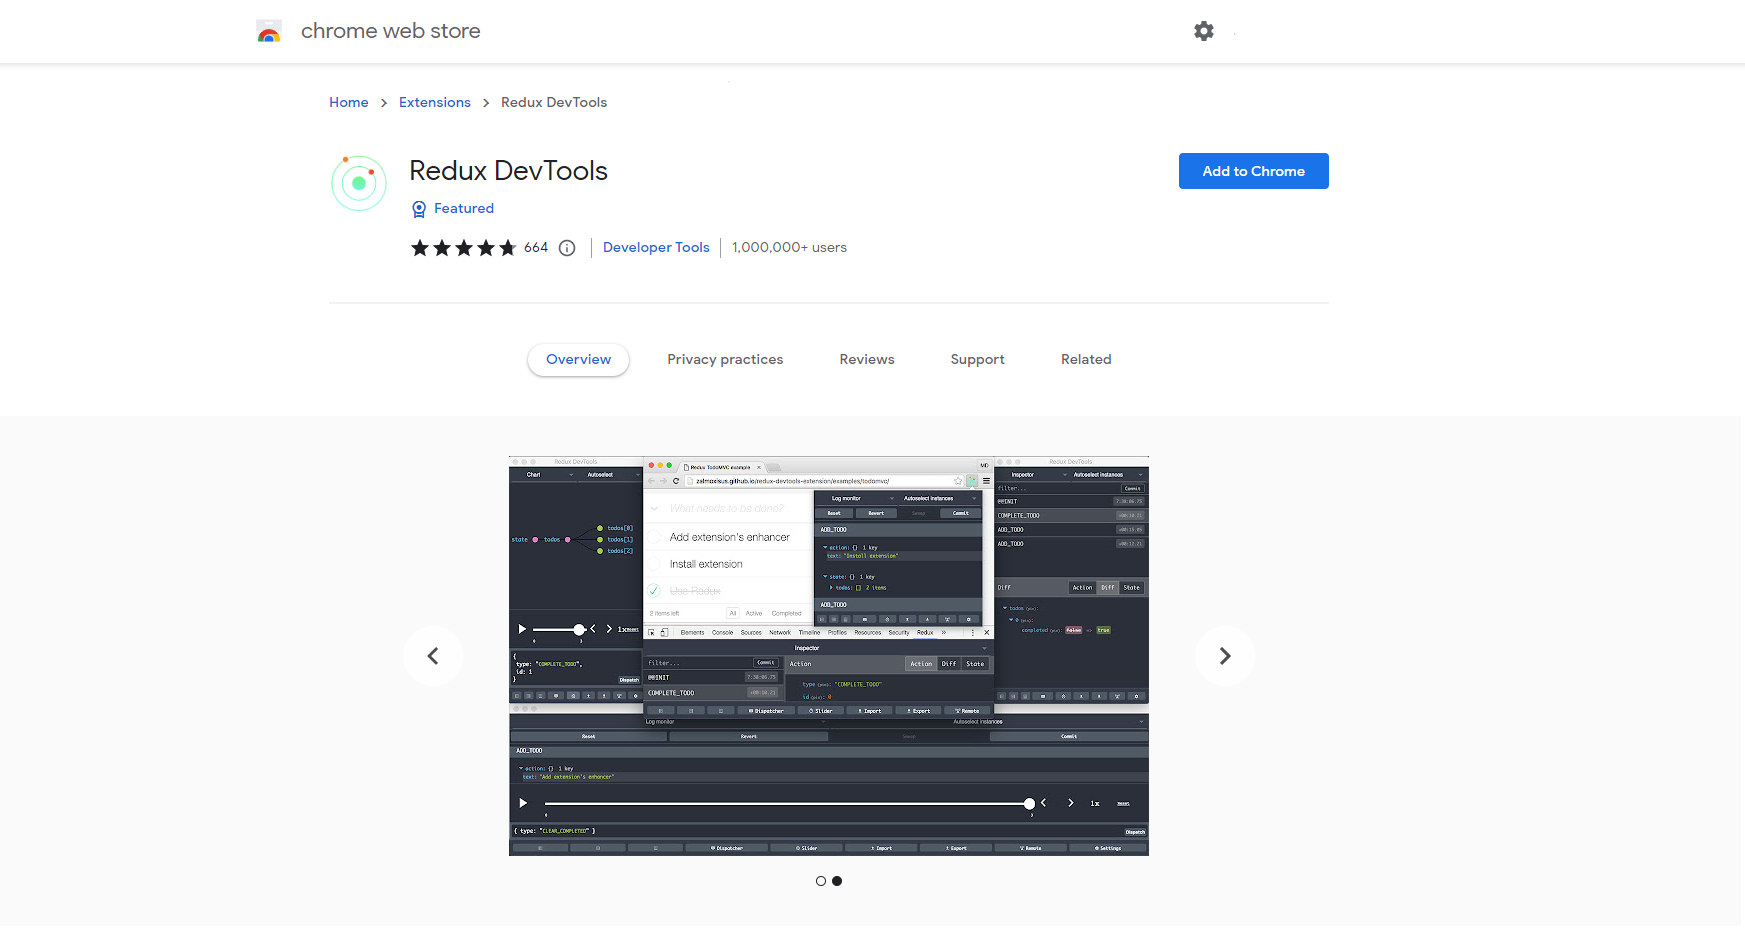
If you want to use Redux DevTools, add the appropriate extension from the Chrome Web Store.
Closing thoughts
Chrome DevTools is a powerful suite of tools that brings substantial advantages to developers and businesses alike. In skilled hands, this instrument becomes a vital element contributing to the delivery of high-quality results in web development.
From enhanced debugging and testing capabilities to seamless performance optimization, WebbyLab professionals harness the potential of Chrome Developer Tool features to create efficient and user-friendly websites.
Whether you aim to improve your current web application or embark on building a new one, feel free to contact us at WebbyLab. Our team provides a smooth and successful development process.
Rate this article !
27 ratingsAvg / 5


