How to Manage a Project Step by Step

Do you know that only 26% of IT projects are completed on time and budget, 46% are late or over budget, and 28% fail? Failure is defined as the project’s inability to achieve its initial objectives. That is why organizations that apply project management claim to see a 30% to 60% increase in performance.
WebbyLab unequivocally supports these statistics. Given that all of our customers aspire to enhance and expand their businesses, we always place the execution of a product or business idea on the rails of successful project management. As we are fully aware that successful product implementation equals a successful business.
Projects are created to provide business value and to deliver benefits defined in the business case and the benefits management plan. The ability to accomplish projects is what drives the realization of expected benefits and the achievement of business objectives. To meet project goals and stakeholders’ expectations, WebbyLab adopts best project management practices.
Managing a project is a constant blend of science and art. And we are here to help you figure out how effectively set up project management processes to succeed in achieving the set project goals in five project management process stages.
You may also be interested in configuration management for Node.js apps. In one of our guides, we described this in depth.
1. Project Initiation
The very first step of managing a project is to agree on project concepts and to initiate the project based on those principles. When viewed through the lens of the project life cycle, this procedure serves as a preliminary preparation for the project.
In the initiating, it is determined whether the business case and benefits management plan can be met, and some high-level planning is done to ensure that the project can be completed within the given scope, schedule, and cost limits. The correspondence of the company culture and existing systems to the business needs is also determined at this stage.
A business case serves as the primary input, and a project charter serves as the result.
Ideally, the sponsor or customer of the project is expected to provide a business case for the project — a documented analysis of the project’s economic feasibility, a list of objectives, and reasons for initiating the project.
From a business standpoint, this is the phase of the project during which the project charter is developed. The project charter is the document that defines the general scope and objectives of the project. Additionally, it identifies and recommends a technological stack for project implementation. We develop guidelines and standards to guarantee that the business case, project charter, and project benefits management KPIs are consistent with one another and with the organization’s goals and objectives.
Likewise, it is critical to note that high-level planning occurs during the project’s initiation.
Occasionally, a customer will only have an idea. In this scenario, we establish the product development initiation phase prior to initiating the software development phase. The primary goal of product management is to create a new product. Its ultimate purpose is to ensure that you design the proper product and that you build it correctly. As a result, our customers need not be concerned if they only have an idea.
Through the following phases, WebbyLab has offered the expertise necessary to lead and make important product decisions:
- Research the market of idea and target audience
- Conduct a competitor analysis
- Determine the high-level functional requirements (proof of concept)
- Build a prototype
Our experience has shown that it is beneficial to provide one or two kick-off meetings with customers before all steps to get the idea.
2. Project Planning
During project planning, the project team conducts a rigorous study to determine whether the project charter’s objectives and anticipated business advantages can be met. Then a choice is made regarding how the project’s objectives will be realized, taking into account all necessary project management processes. This entails assessing which procedures are suited for the project’s requirements and customizing them to those requirements.
This is the commencement of the project from a project life cycle standpoint. That’s the phase in which the project’s Who, What, Where, When, and How’s are addressed.
Defining an approach is a critical decision in this process. At WebbyLab, we prefer to collaborate directly with our customers and assist them in selecting the right approach.
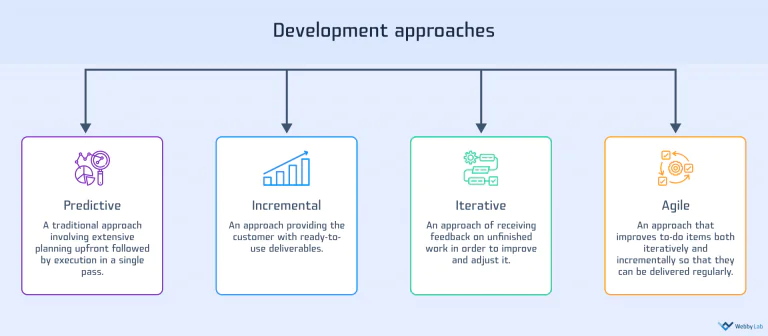
A feature of a predictive approach is its emphasis on requirement specification and comprehensive planning during the project’s initial phases. Plans that are detailed and based on known requirements and constraints can help mitigate risk and cost. Process monitoring and control are focused on limiting changes that may have an impact on content, schedule, or budget.
A characteristic of a highly adaptive approach is the gradual evolution of requirements through short iterative planning and execution cycles. Risk and expense reduction are accomplished by incremental plan modifications. Key stakeholders are always involved and frequently provide feedback in the form of comments and suggestions, which enables changes to be implemented more rapidly and with a higher level of quality.
For one of our clients, a leading Ukrainian agricultural holding, an incremental approach has been applied when developing a B2B e-commerce portal (by the way, learn more about eCommerce ecosystems). Since the business requirements were not entirely obvious and precise at the start of the project, a “rolling wave” method was used to clarify them. This enabled us to collect input and clarify requirements immediately to maximize the satisfaction of all stakeholders’ demands.
The Project Management Plan is the key output, and it contains the project budget, scope, scheduling, resources, project communications, and risk management. These components may vary during the project’s execution, but planning everything ahead of time is a smart move.
Project Management Plan may look different based on project size: large, medium, or small.
Generally, a large project (which takes between 6 and 24 months to complete) has one or more sub-projects and a few development teams. We have experience working with multiple teams on such a project. The team of one of our clients, the smart home automation platform, was structured as follows: two teams and one project manager. Each team consisted of a team lead, four to seven developers, and one QA. To maintain order in the project and to successfully synchronize the work, it was very important to consist of team leads separate and project manager general.
For scenarios with a large number of teams, one manager is not enough. Therefore, in order to maintain the productivity and effectiveness of teams, we are increasing the team of managers. For instance, one of our project products, the IoT management platform 2Smart contains two project managers, 2-3 teams of 4-5 developers, one business analyst, and one UI/UX designer. The project has been ongoing for two years and continues to do so.
For large projects, all Project Management Plans are required. Also, large projects require a full-time project manager and a sufficient level of sponsorship.
A medium project (which takes 3-6 months to complete) is typically associated with moderate risk and complexity. It enables us to distinguish between mandatory plans and those that are optional. For example, project communications and project risk management are both important. In WebbyLab, our practice has shown that the requirement for medium-sized projects is primarily driven by the necessity of completing them as soon as possible. As a result, to properly carry out the planning process, we construct the plans that are most important for work, and we discuss medium-priority plans at the initial call to ensure that everyone is on the same page with the process.
For such scenarios, it is very important to quickly form an agile team with key positions. And of course, we had such an experience. We created a limited-time MVP B2B portal in three months for another of our clients, MHP. The team consisted of one PM, one BA, three developers, and one QA. This way, we applied an agile project management approach.
Additionally, we have experience implementing a team for a particular part of a project. For instance, one of our customers had difficulties due to a shortage of front-end teams. In this case, we assembled a front-end team comprised of three to four developers, one quality assurance specialist, and one project manager. Our team communicated with the client’s backend and product teams.
Having a kick-off meeting will help speed up the project’s progress. During the meeting, there is an opportunity to collaborate with the team; discuss the tasks at hand, project timeline responsibilities, and any deviations from the original plan.
Alexey Krol
Chief Business Development OfficerConsulted 30+ IoT startups to speed up time to market.
Get a Consultation3. Project Execution
The purpose of project execution is to finish the project work as specified in the project management plan to accomplish the project goals and deliver the expected business value. The focus is on including stakeholders, working with the team to fulfill tasks, adhering to processes, and communicating as planned.
At WebbyLab, we use specialized toolkits such as a Trello board, Jira, and Confluence to keep everyone focused on completing the project according to the project charter and project management plan.
Also, meetings are necessary to identify and resolve issues, assess risks, and keep the project on track. The Scrum framework contains valuable guidance on how to perform ceremonies (daily stand up, sprint planning, retrospective, backlog refinement, etc.).
Taking our client’s smart home automation platform as an example, business needs were gathered during the planning stage using a predictive approach. However, due to the requirement for quick feedback, it was decided to include elements of an incremental approach. Since several modular teams were running at the same time and changes in one module could affect blocks from another module, a weekly architectural meeting was introduced. It enabled timely notification of all project participants of subsequent changes and an early assessment of the module’s level of influence.
To keep everyone on the same page, a communication framework must be established. After considering the impact of factors like location, culture, security, privacy, and language on communication on the project, we decided on Slack and Skype for WebbyLab as our primary communication tools. It is beneficial to practice using communication tactics throughout the project, such as:
- Active listening
- Feedback
- Presentations
- Meeting management
- Communications technology between client and development team (e.g. face-to-face, over the phone, in writing, through instant messaging, and via email)
We can efficiently manage the team and understand the progress if we work with the schedule and milestones on a regular basis. Understanding the status of accomplishment enables the adoption of corrective operations such as crashing, fast-tracking, and reestimating to compress the schedule.
In WebbyLab, we also recommend Iterative backlog scheduling is a form of rolling wave scheduling that is based on adaptive IOT product lifecycles like agile product development.
Using lessons learned is a tool for ensuring the best possible quality of development. As a result of more than 200 completed projects, we were able to create a repository of the best development practices. Our PMO conducts a thorough review of each project following the deployment checklist.
The optimum project execution practice is to ensure that the project team works as effectively and efficiently as possible. To ensure this, it is recommended that team members receive training, participate in team-building activities, and be motivated.
We have a quarterly team-building framework in place at WebbyLab. They assist team members in becoming more motivated, bringing them closer together, getting to know one another, and unlocking leadership potential.
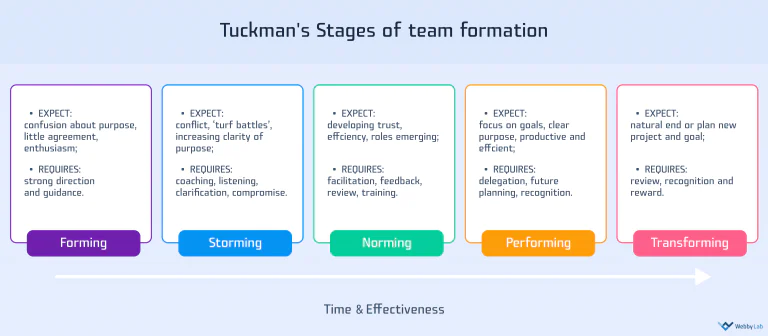
It’s critical to remember while managing projects of varying sizes that you shouldn’t demand 100 percent performance excellence from the team on the first day. It’s worth noting that each freshly formed team goes through the following phases: forming, storming, norming, performing, and adjourning/transforming. And the team’s full performance can be expected throughout the norming/performing stage.
However, there are potential pitfalls here as well. Each phase’s time is proportionate to the project’s size. For instance, the formation of a medium-size project takes two weeks, whereas the formation of a large-sized project takes three to four weeks. A huge number of interested parties explain this reality. As a result, the likelihood of colliding interests and personal characteristics grows, as does the number of conflicts.
4. Project Monitoring and Controlling
Although monitoring and controlling are placed together in one process group, each has a distinct purpose. Monitoring necessitates paying close attention to the project’s progress. It helps in comprehending how stakeholders are involved, communicating, and feeling about the project, the work, and the identified uncertainties. Controlling entails analyzing hard data to determine how closely the project adheres to the plan and taking action to address deviations that exceed acceptable limits — for example, by recommending changes to the way work is performed or possibly adjusting baselines to reflect more achievable outcomes.
From a high-level perspective, it helps evaluate project performance and compare results to set targets. Using project metrics and key performance indicators to assess project performance is a smart practice. Because each project is unique, our company engineers the project’s metrics independently for each project. It is a good practice to do so using the SMART framework. As a supplement, the following essential project metrics typically cover the most critical indicators: productivity, the scope of work, quality and satisfaction, cost, and cross-margin.
We employ quality control methods such as inspections, performance reviews, and cause-and-effect diagrams to ensure product quality. Non-financial measurements are also useful to help assess, report, and drive success. They include customer satisfaction, process excellence, and employee satisfaction.
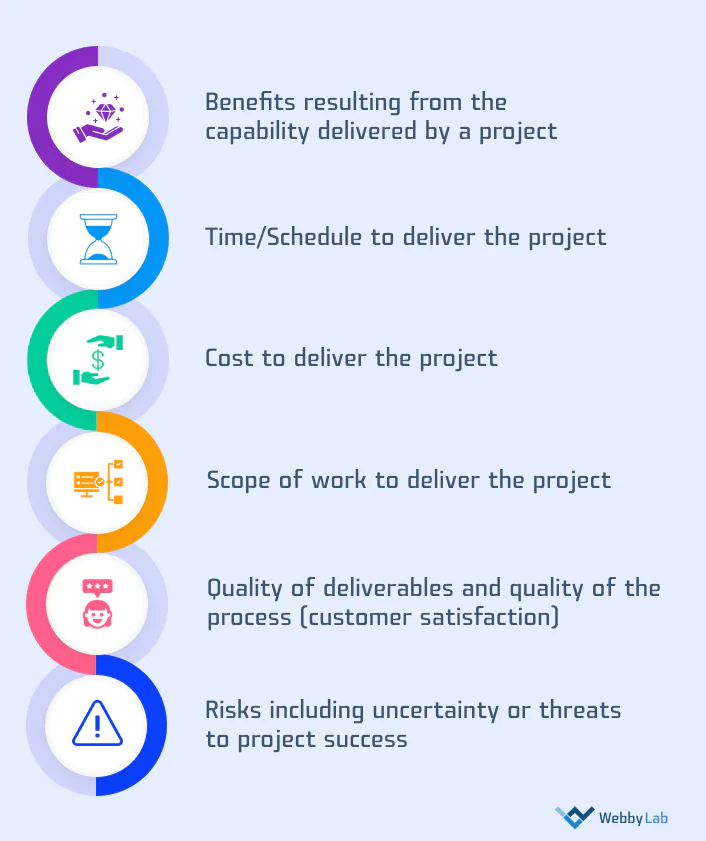
From the project manager perspective, we use well-known six factors which can be measured to create metrics that determine project success:
For improved management and control (M&C), we employ task managers (Trello, Jira) to handle software development. Keeping up to date is made easier by creating tasks, to-do list items, communicating, handling issues and risk, and managing project budgets all inside the same task platform.
We recommend generating systematic reports for customer comprehension in order to keep track of earned value. Given that the value of a project can take on a variety of different interpretations for stakeholders, we negotiate with each client to determine the form of a report that will be most beneficial to them. The primary aspect is that the report must have all of the necessary information for a project to be successful.
Throughout the project, one of the most effective reports is a demo presentation. Responsive approaches advocate for conducting a sprint demo to demonstrate the output and a retrospective to document the lessons learned.
In WebyyLab, we concluded that even when a predictive approach is used, it is vital to conduct numerous intermediate demos to obtain feedback on completed work as soon as possible.
5. Project Closure
Project Closing comprises any work required to deliver the completed project to those who will use it, as well as soliciting customer feedback on the product and project. This stage confirms that all of the project’s requirements have been fulfilled.
Within WebbyLab, we have made recommendations on how to work with environments and release management, as well as how to prepare the codebase and documentation for transfer to customers.
It is considered a best practice to describe any artifacts that will be transferred to the customer with whom you will be communicating during the initiating process.
After a project has been successfully evaluated, it is recommended to gather information about the team’s competence.
In many real-world situations, projects never appear to reach their finish. It relates to project production and customer feedback. We have updated these terms and conditions in WebbyLab and added a warranty period to our contract. If our customer recognizes that the new business objectives will be greater, we suggest a support contract.
Conclusion
Making our customers happy is one of our company’s key priorities. WebbyLab’s policy is geared around assisting our clients with their business plans. Therefore, we follow the traditional project management recommendations for successful project implementation.
Likewise, we systematically update our project management steps in an effort to maximize stakeholder satisfaction by implementing up-to-date guidelines.
Explore how WebbyLab can assist your company in achieving strategic business objectives. Please contact us to learn more about our project management experience and how we can help you with your needs.


Written by:

Mariia Kunieva
PMO Leader
I have been working as a Project Manager for over 4 years. One of my main achievements is PMP Certified I consider myself a big fan of planning and coaching My professional mission is to bring ideas to life and project management helps me in this

